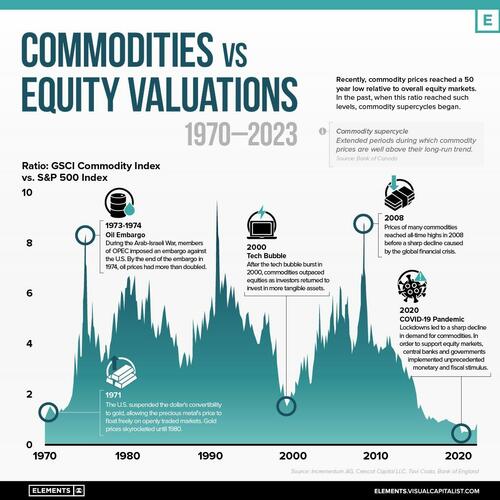
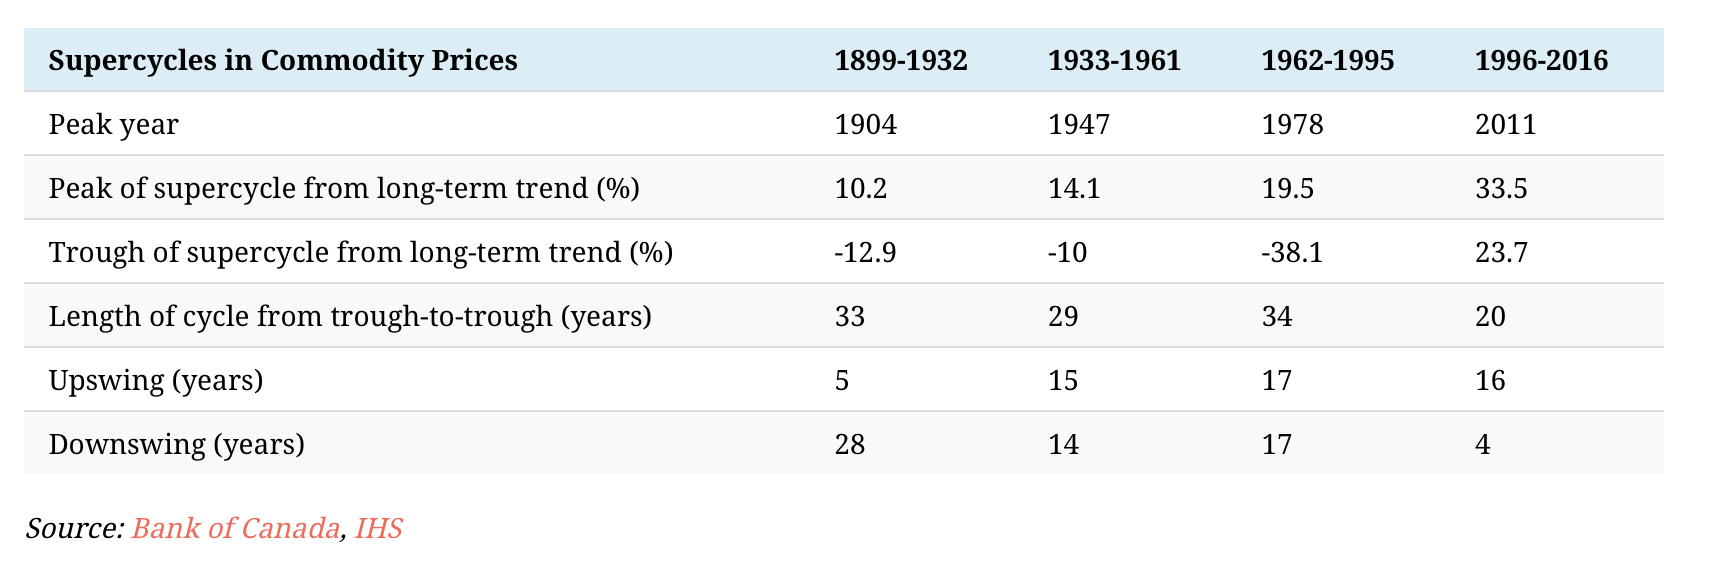
According to the Bank of Canada: Commodity super-cycles are extended periods during which commodity prices are well above their long-run trend. In recent years, commodity prices have reached a 50-year low relative to overall equity markets (S&P 500).
Historically, lows in the ratio of commodities to equities have corresponded with the beginning of new commodity supercycles.
As Visual Capitalist’s Bruno Venditti shows in the infographic below, using data from Incrementum AG and Crescat Capital LLC, the relationship between commodities and U.S. equities has varied greatly over the last five decades.

Recently, commodity prices reached a 50 year low relative to overall equity markets. In the past, when this ratio reached such levels, commodity super-cycles began. While no two super-cycles look the same, they all have three indicators in common: a surge in supply, a surge in demand, and a surge in price.
The relationship, however, is not always straightforward and can be affected by various other factors, such as global economic growth, supply and demand, inflation, and other market events.
With the most recent commodity supercycle peaking in 2011, could the next big one be right around the corner?

View more here:
