By Cassandra McBride
Last Updated: Nov 25, 2025
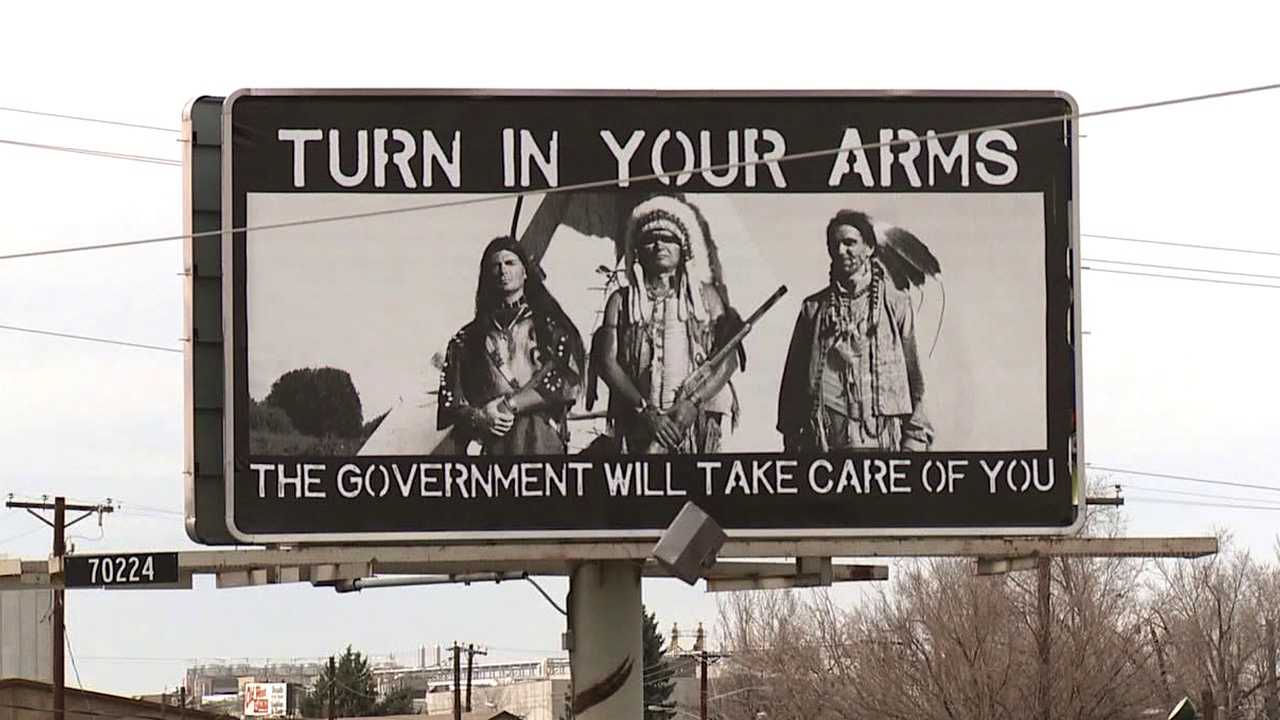
Report Highlights: Between 56% to 61% of Americans favor stricter gun laws, while 10%favor more relaxed laws.
- Women are more supportive of gun control (64%) compared to men (51%), who are more skeptical.
- Younger adults (18-29) show strong support at 62%, but this decreases with age.
- Support is highest among postgraduates (72%), while many without college degrees remain unconvinced.
- Only 28% of Republican-leaning individuals support stricter laws, compared to 86% of Democrat-leaning individuals, highlighting a deep political divide.
Related Studies: Gun Control Laws and Enforcement Trends | Gun Violence Statistics | Gun Laws vs. Crime Rates
Ammo.com uses high-quality sources to ensure accurate and reliable reporting. Review the sources used in this article HERE.
Methodology
Support for gun control is subjective, so we rely on self-reported surveys to gauge Americans’ opinions on the issue.
Such surveys can vary significantly, and may contain biases. We used data from multiple sources in the interest of providing a balanced and accurate representation of Americans’ attitudes toward gun laws.
It’s important to note that the terms “Gun Laws” and “Gun Control” cover a wide range of legislation that restricts firearm access. While many Americans generally favor some form of gun control, this report does not capture varying levels of support. For instance, most Americans may support laws that restrict access to handguns, but not outright bans.
Note: Differences between the Johns Hopkins National Survey of Gun Policy and polls from Gallup or Pew Research Center largely reflect how each defines “gun control.” NSGP measures support for individual regulations, whereas Gallup and Pew measure general sentiment toward stricter gun laws. These metrics are not interchangeable, and direct percentage comparisons may misrepresent shifts in public opinion.
Public Opinion on Gun Control in the United States
Recent surveys suggest that 56% to 61% of Americans support gun control. (Pew, 2023/Gallup 2024)
More than a quarter of Americans (26%) feel that gun laws should be kept the same, while 10-15% of Americans feel gun controls should be less strict. (Pew, 2023/Gallup 2024)
This support is highly divided along demographic lines such as gender, age, education, and political affiliation. This highlights the complexity and polarization of the gun control debate in the United States.

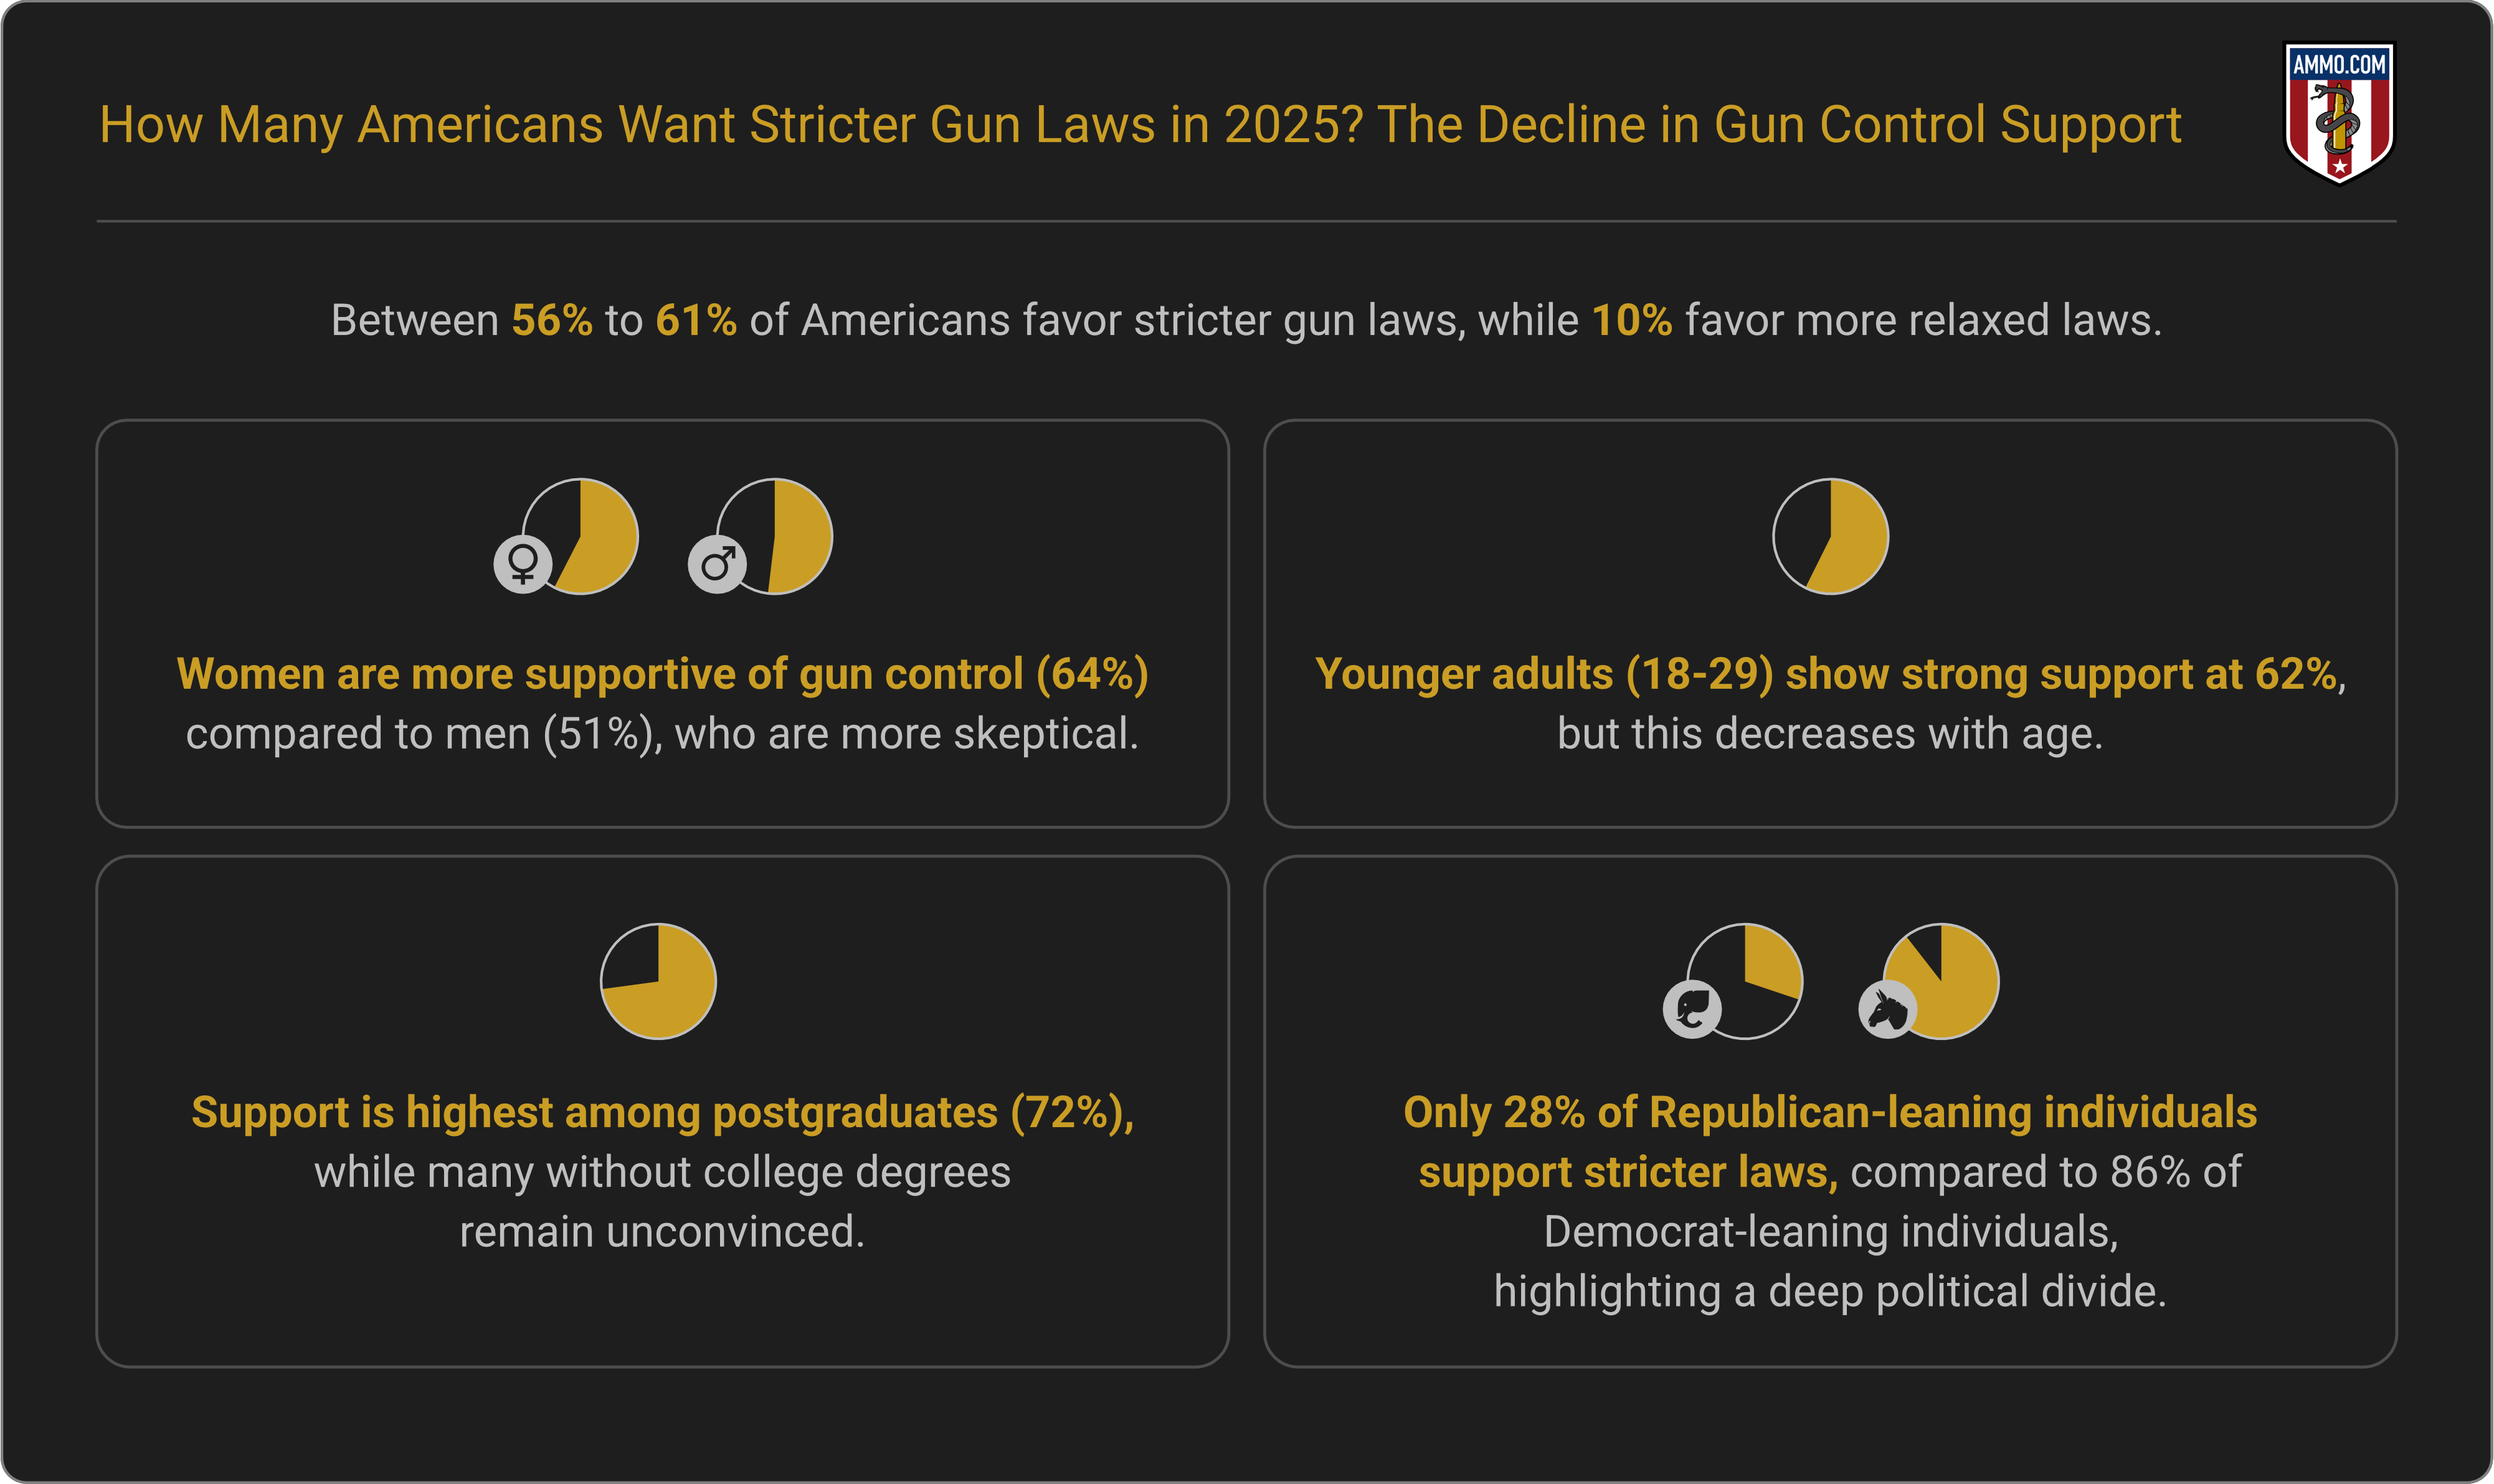
How Many Americans Want Stricter Gun Laws by Political Party?
According to Pew, only 28% of Republican-leaning individuals back stricter gun purchase laws. Within this group, moderate or conservative Republicans show the least support, with only 19% in favor, while liberal-leaning Republicans are more supportive at 42%. (Pew, 2023)
Support for gun control is significantly higher among left-leaning Americans. Liberal-leaning Democrats are most likely to support gun control (92%). Even among conservative and moderate Democrats, support remains high at 81%. All together, 86% of Democrat-leaning Americans support gun control. (Pew, 2023)
A smaller 2025 Johns Hopkins survey suggests that 63% of Republicans and 82% of Democrats support requiring permits to purchase. (Johns Hopkins, 2025)
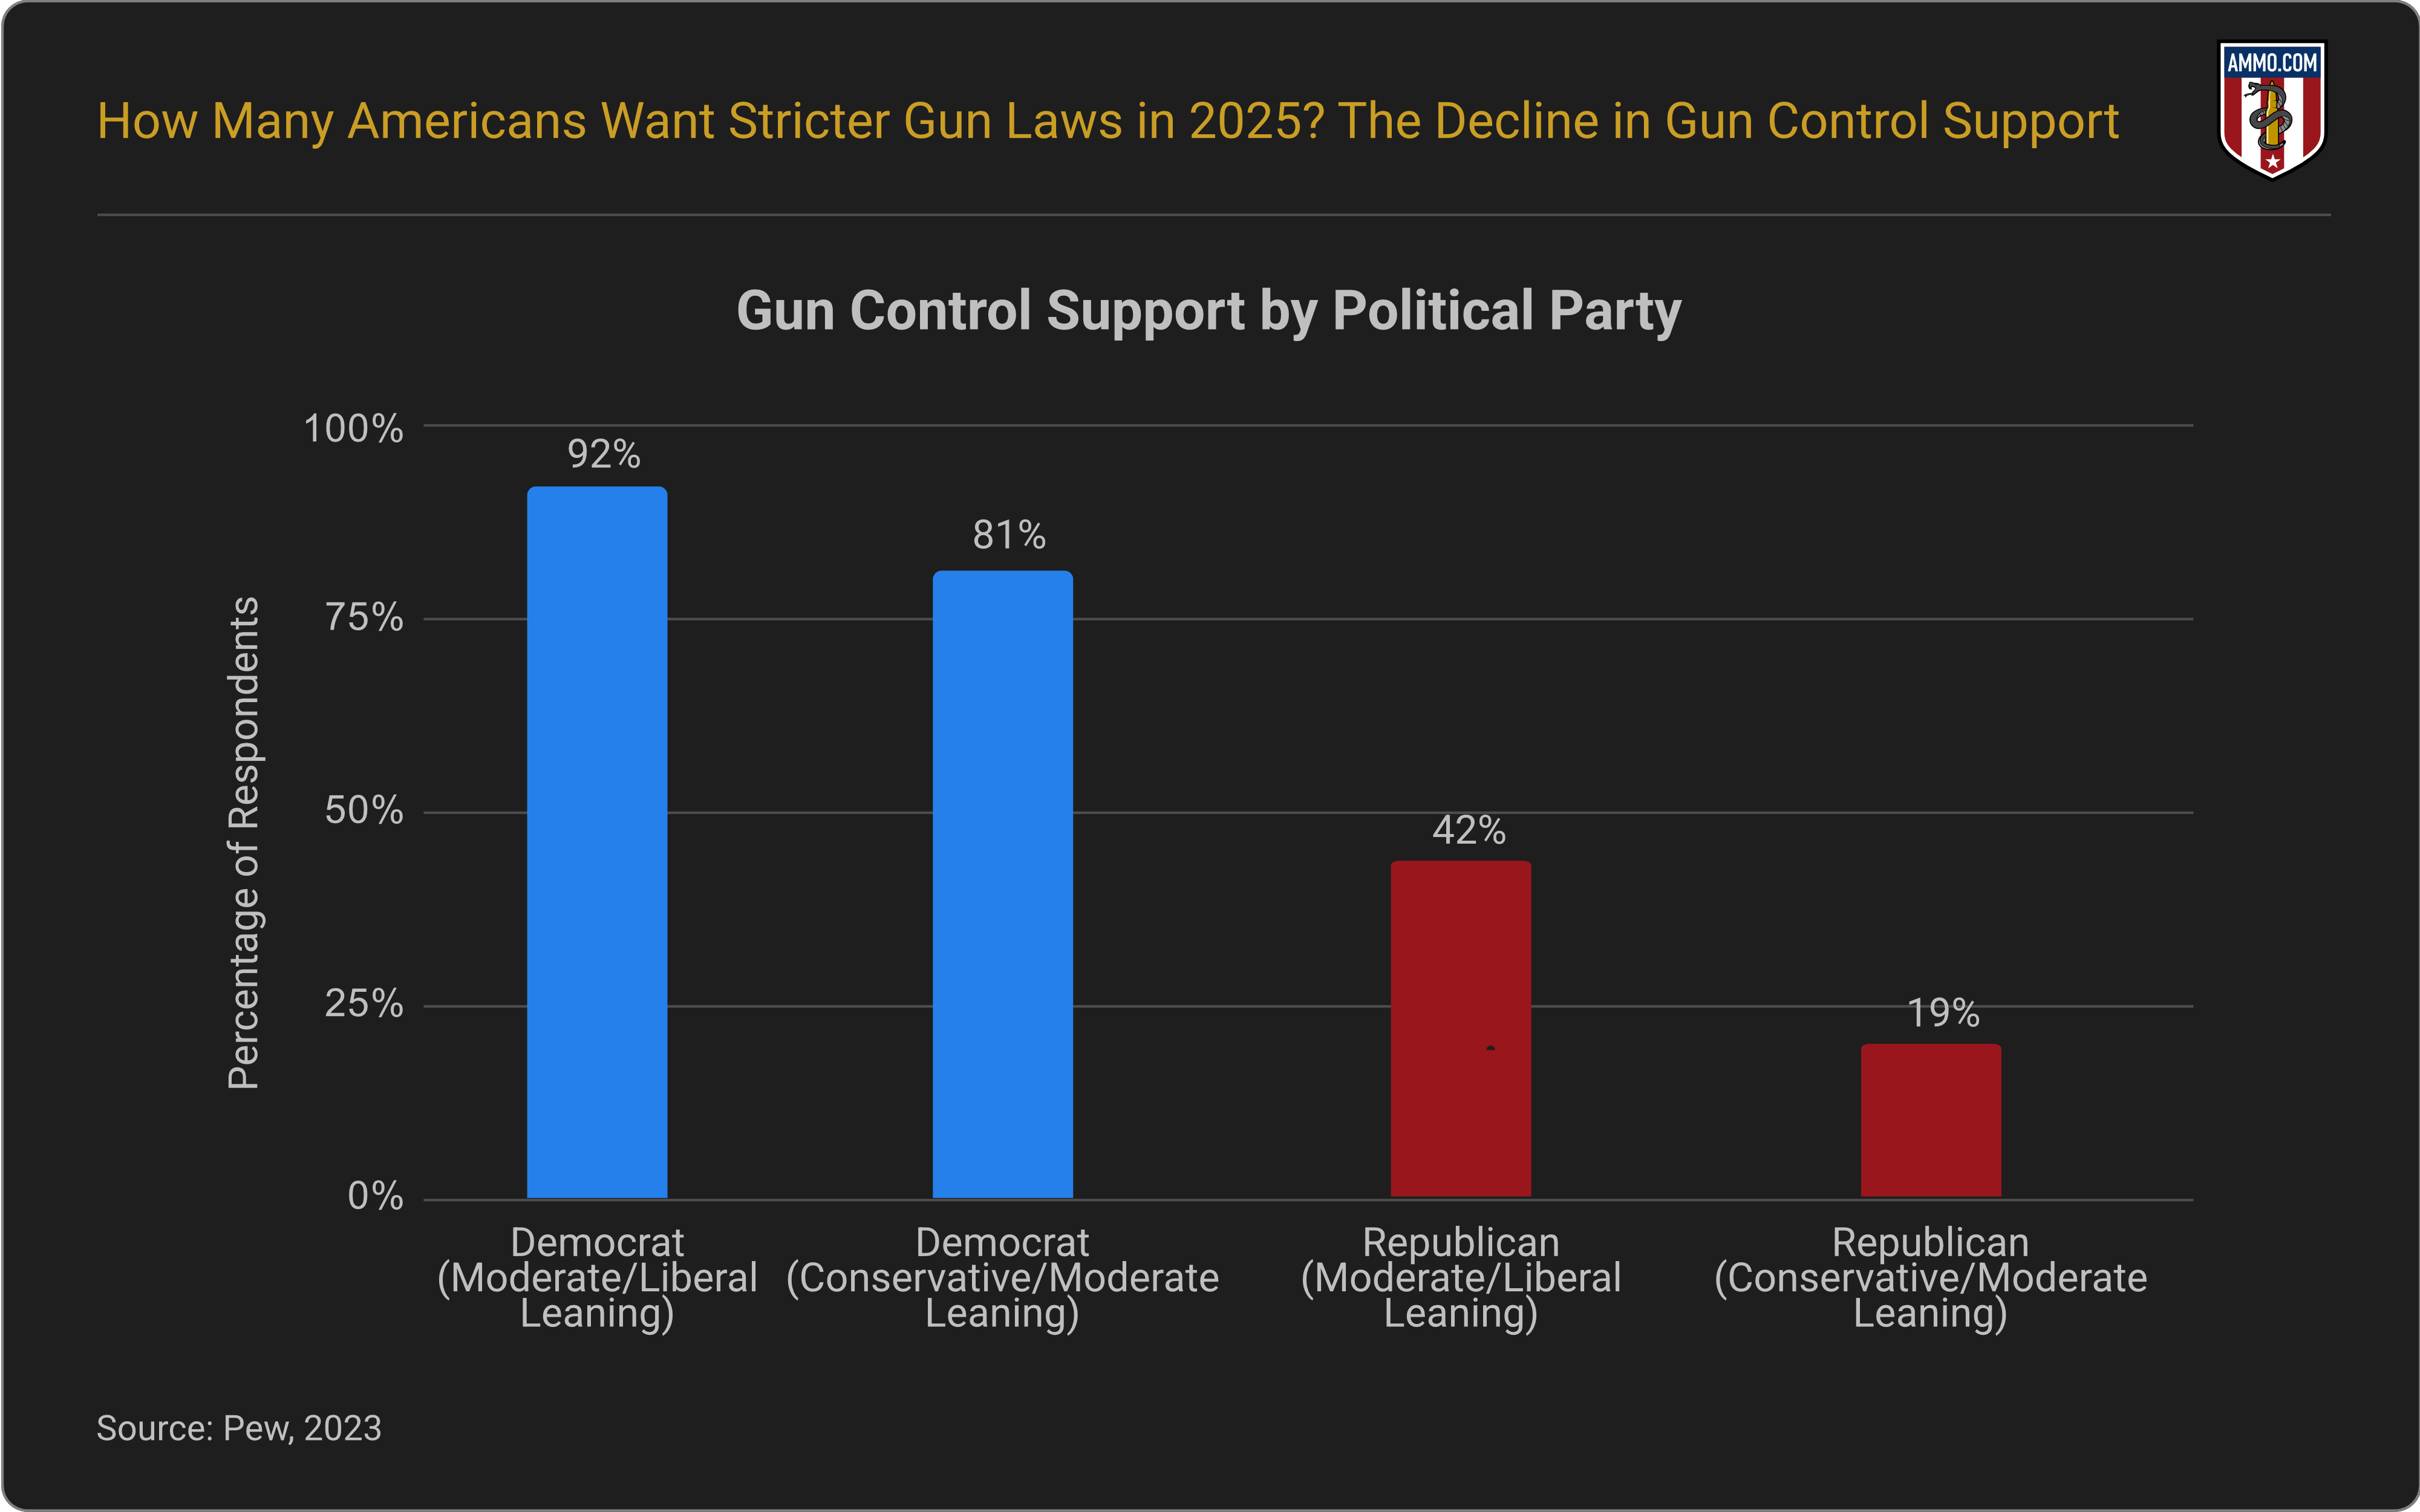
How Many Americans Want Stricter Gun Laws by Age?
Support for strict gun control tends to decrease with age. Young adults aged 18 to 29 show the highest level of support at 62%. This figure drops to 55% among those aged 65 and older.
Support for relaxing gun control laws remains consistent among all age groups. 15% of Americans aged 18 to 64 favor relaxing gun laws, and 14% of those over 65 agree.
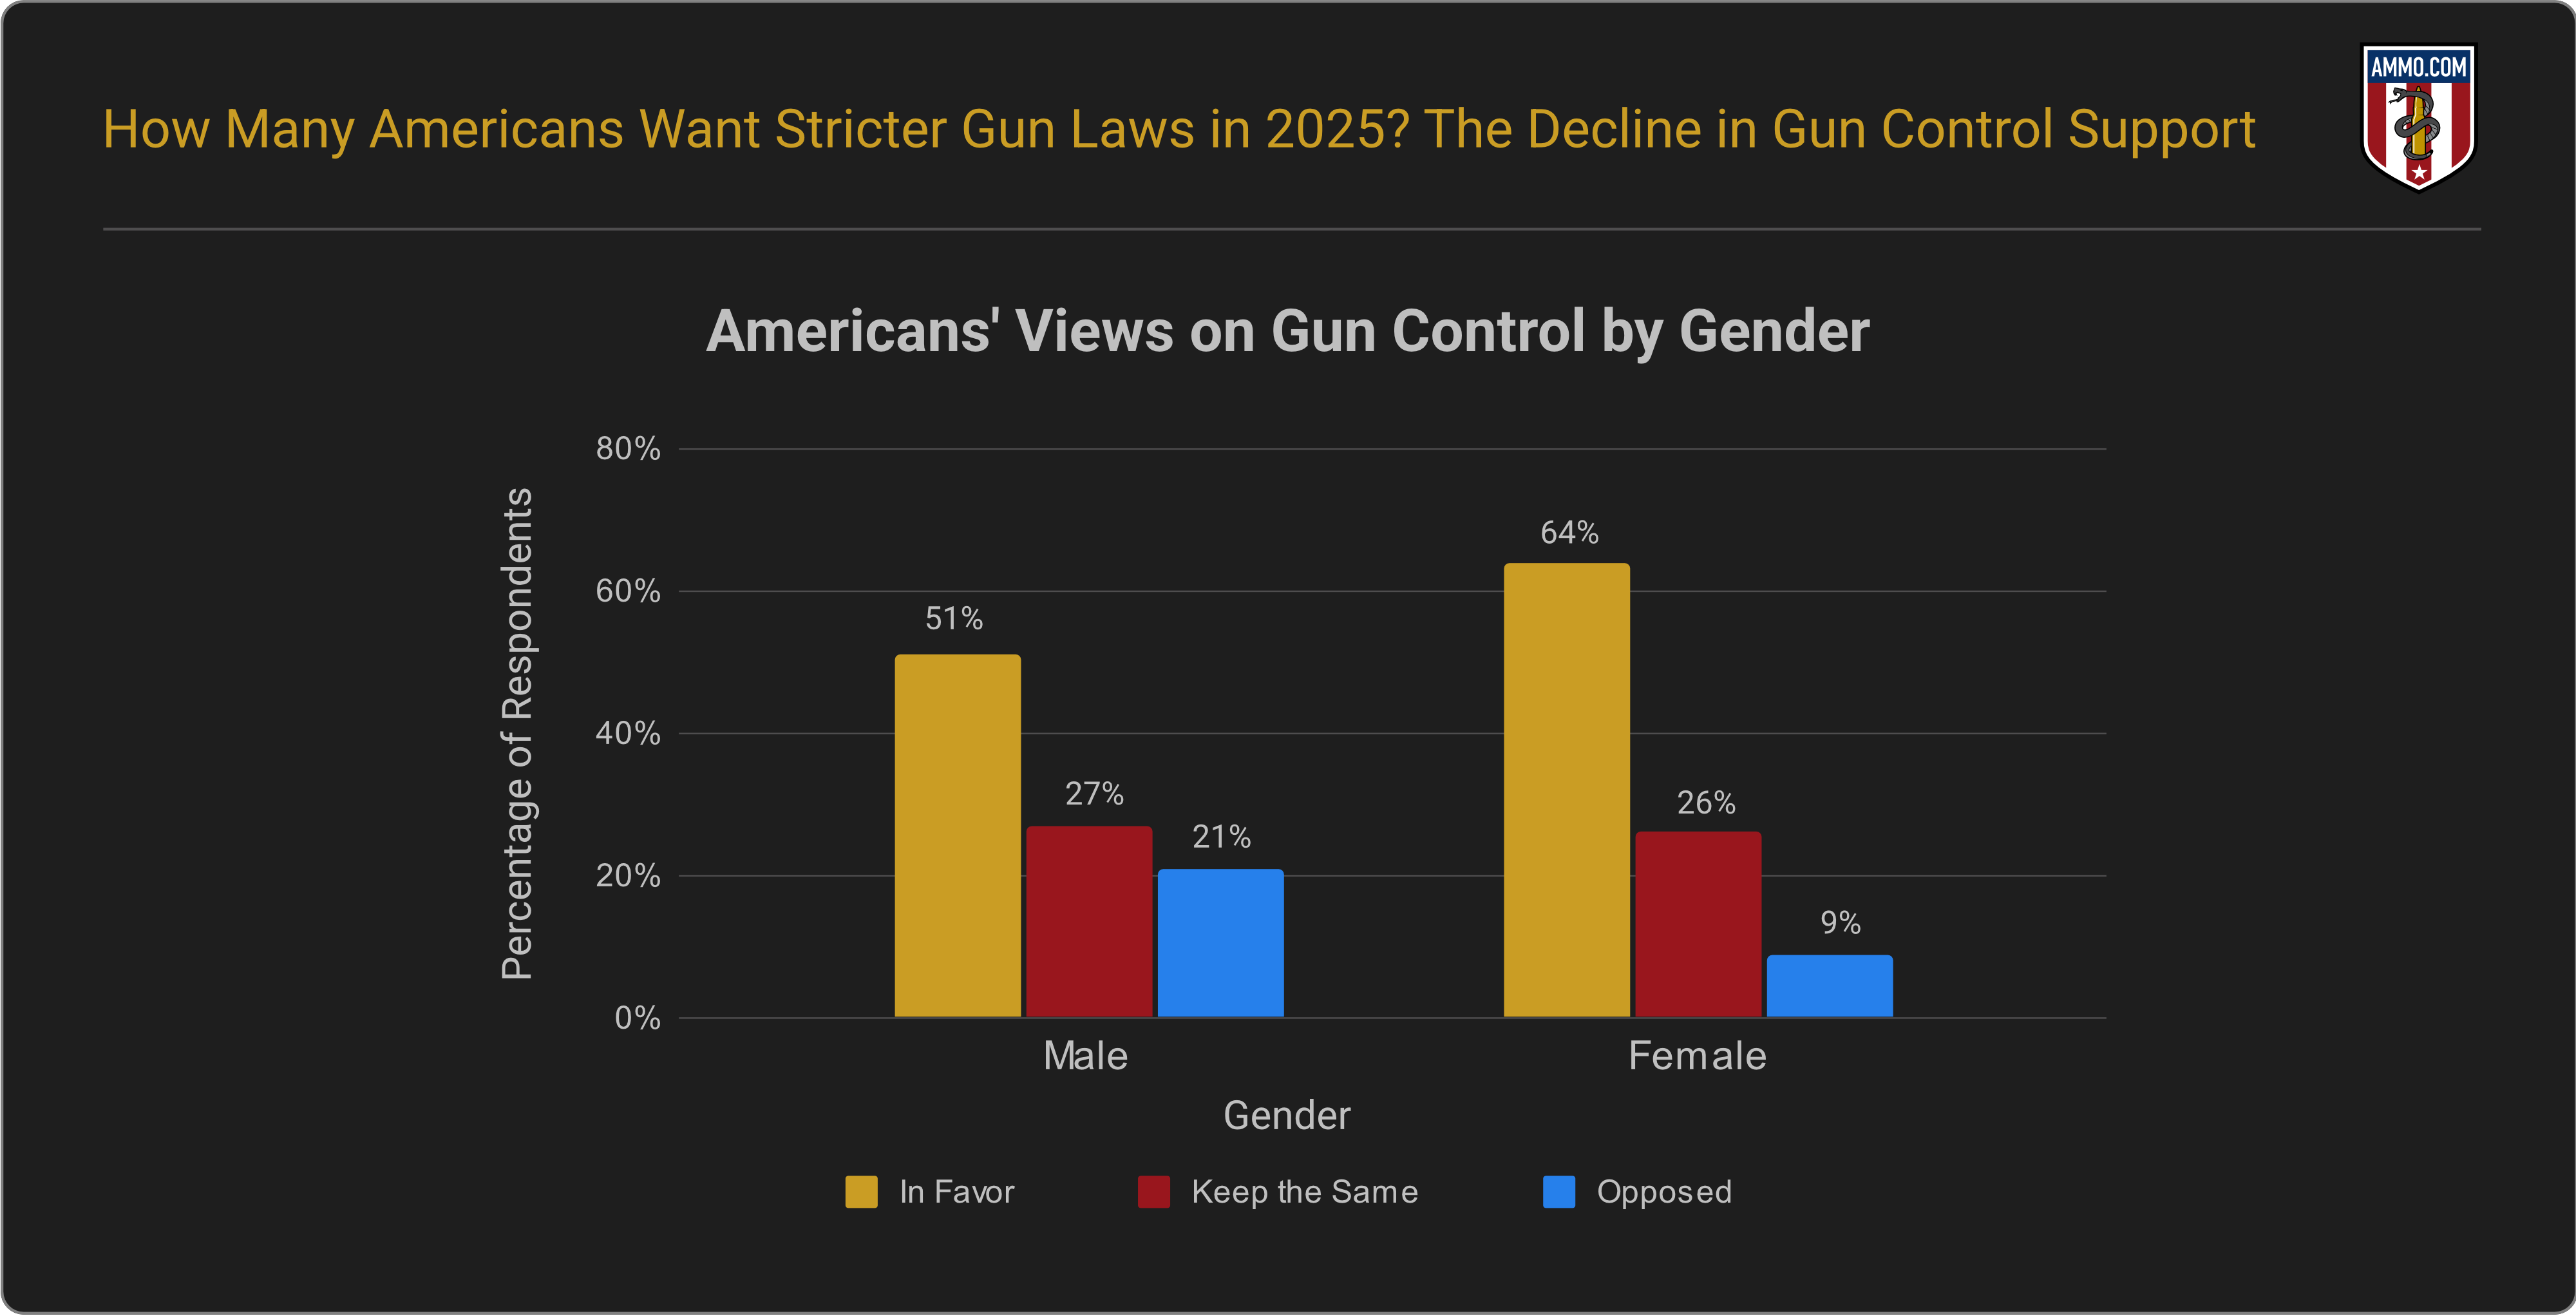
How Many Americans Want Stricter Gun Laws by Gender?
Women are significantly more likely to support stricter gun laws than men, with 64% of women in favor compared to only 51% of men.
Additionally, men are more likely to oppose gun control, with 21% against it, compared to just 9% of women.
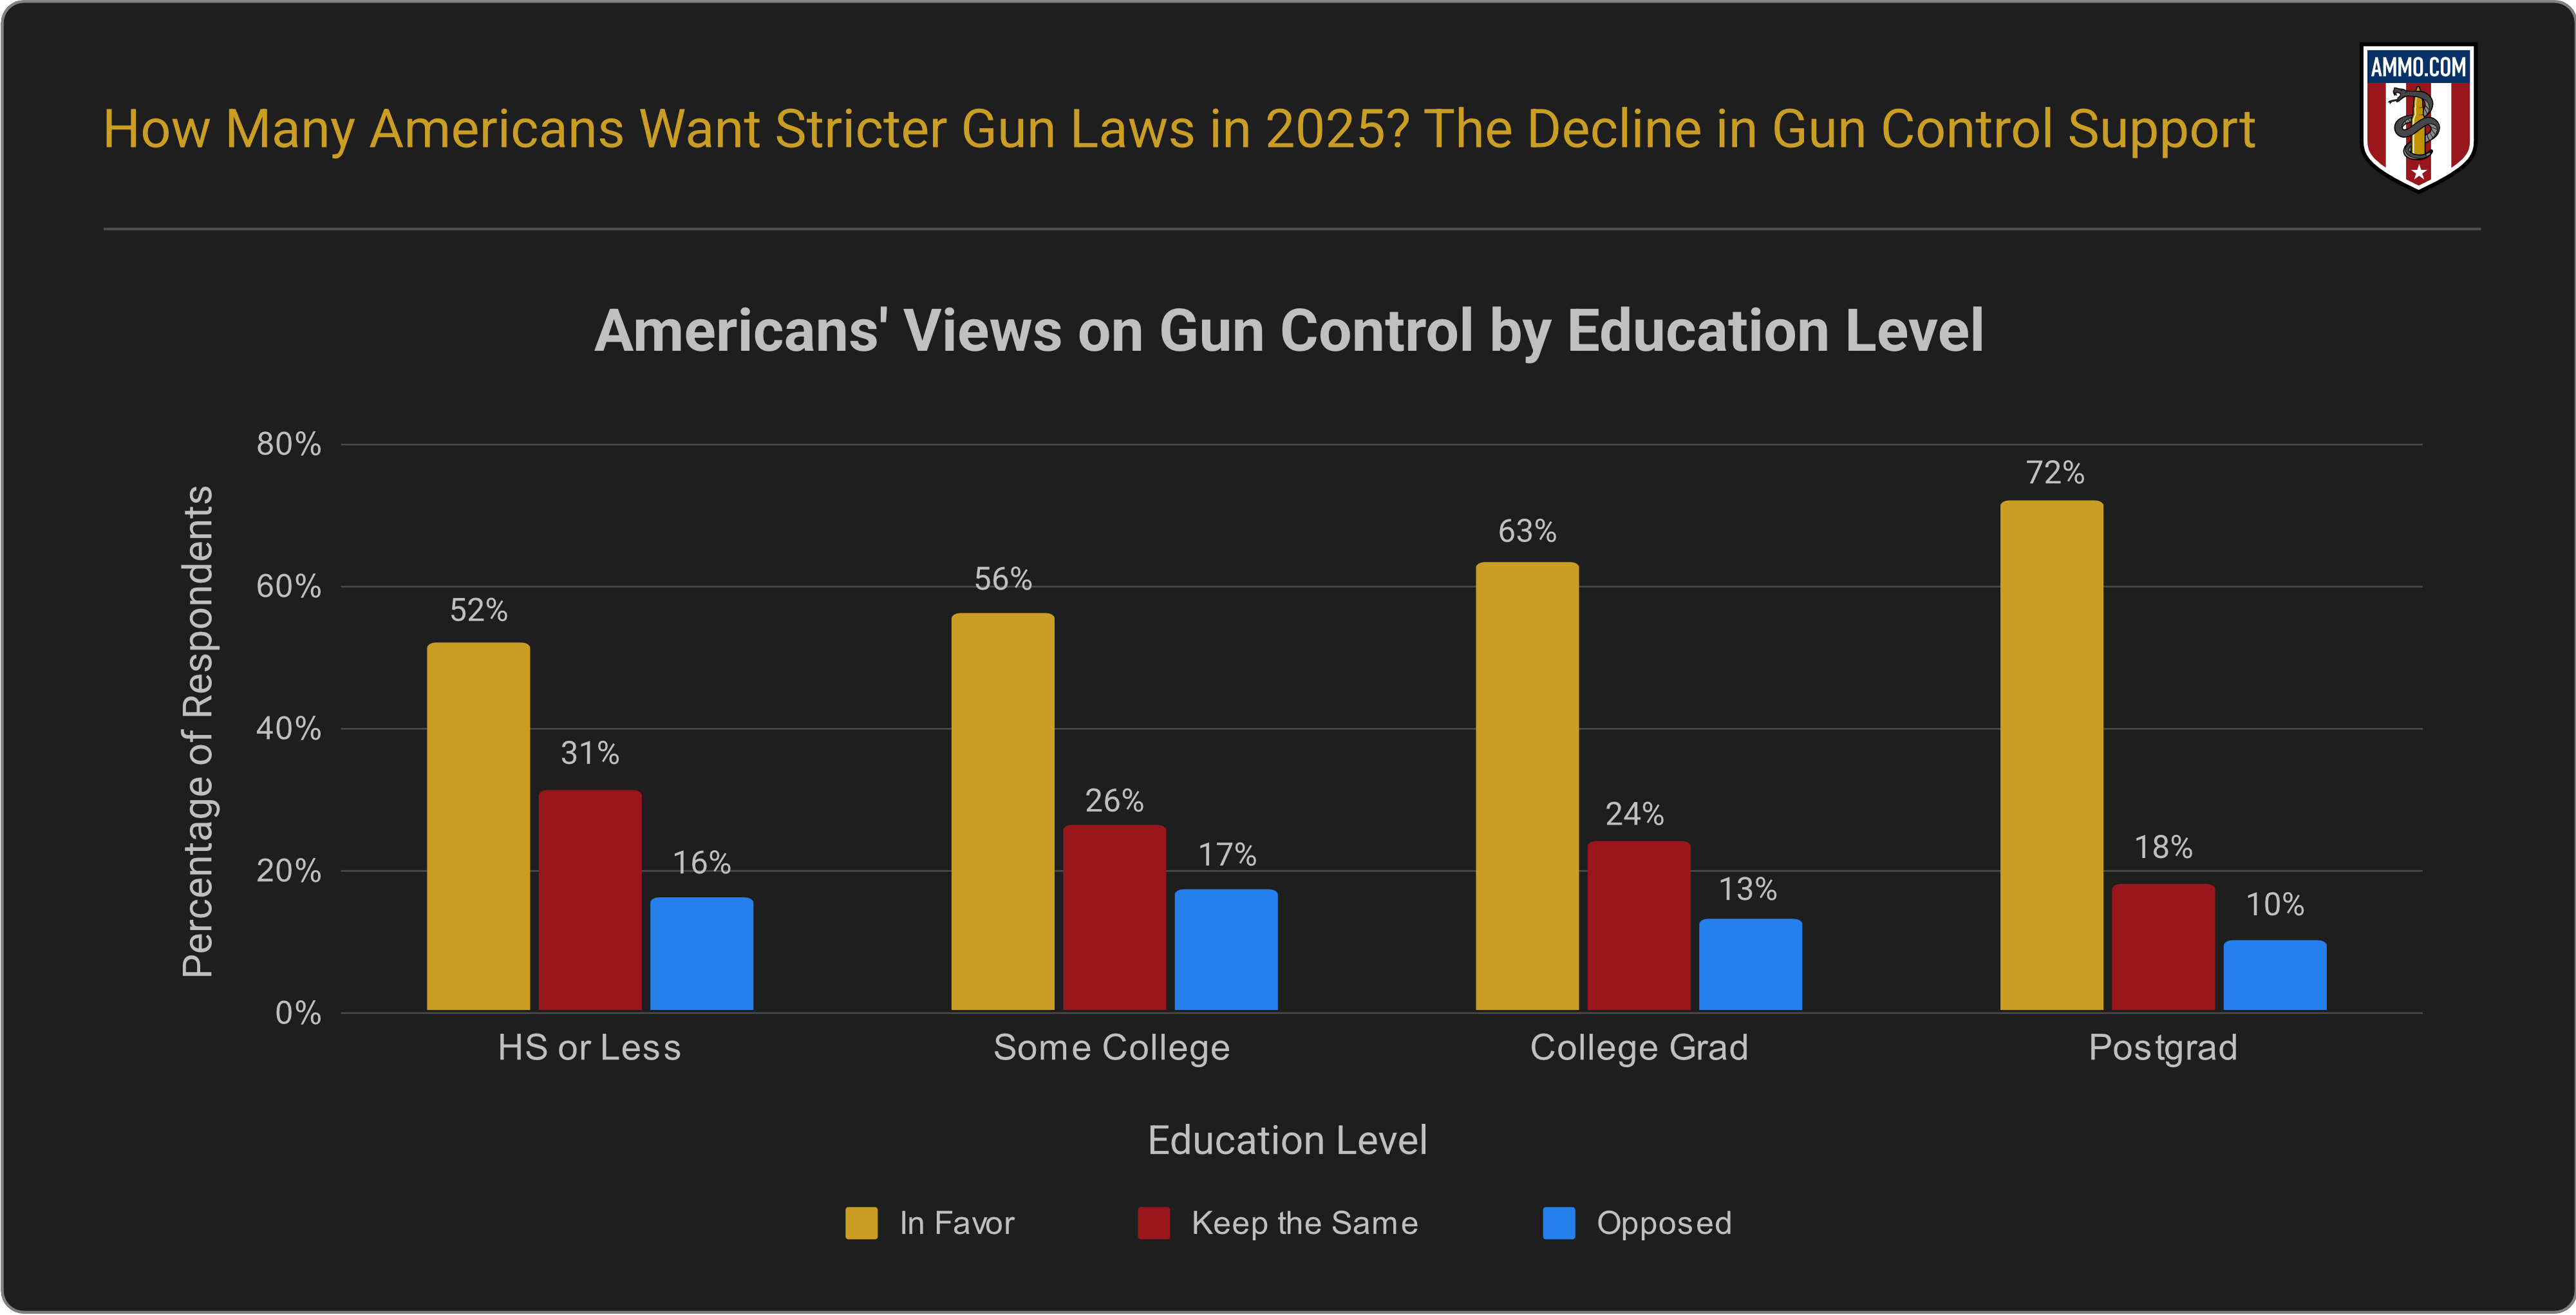
How Many Americans Want Stricter Gun Laws by Education Level?
Americans with higher education levels show the strongest support for stricter gun laws. Among them, 72% of those with postgraduate degrees favor more stringent regulations, followed by 63% of those with college degrees.
In contrast, support is lower among those with only a high school education or less. Of this group, 52% are the least likely to back stricter gun laws, although 56% still express support for increased regulations.
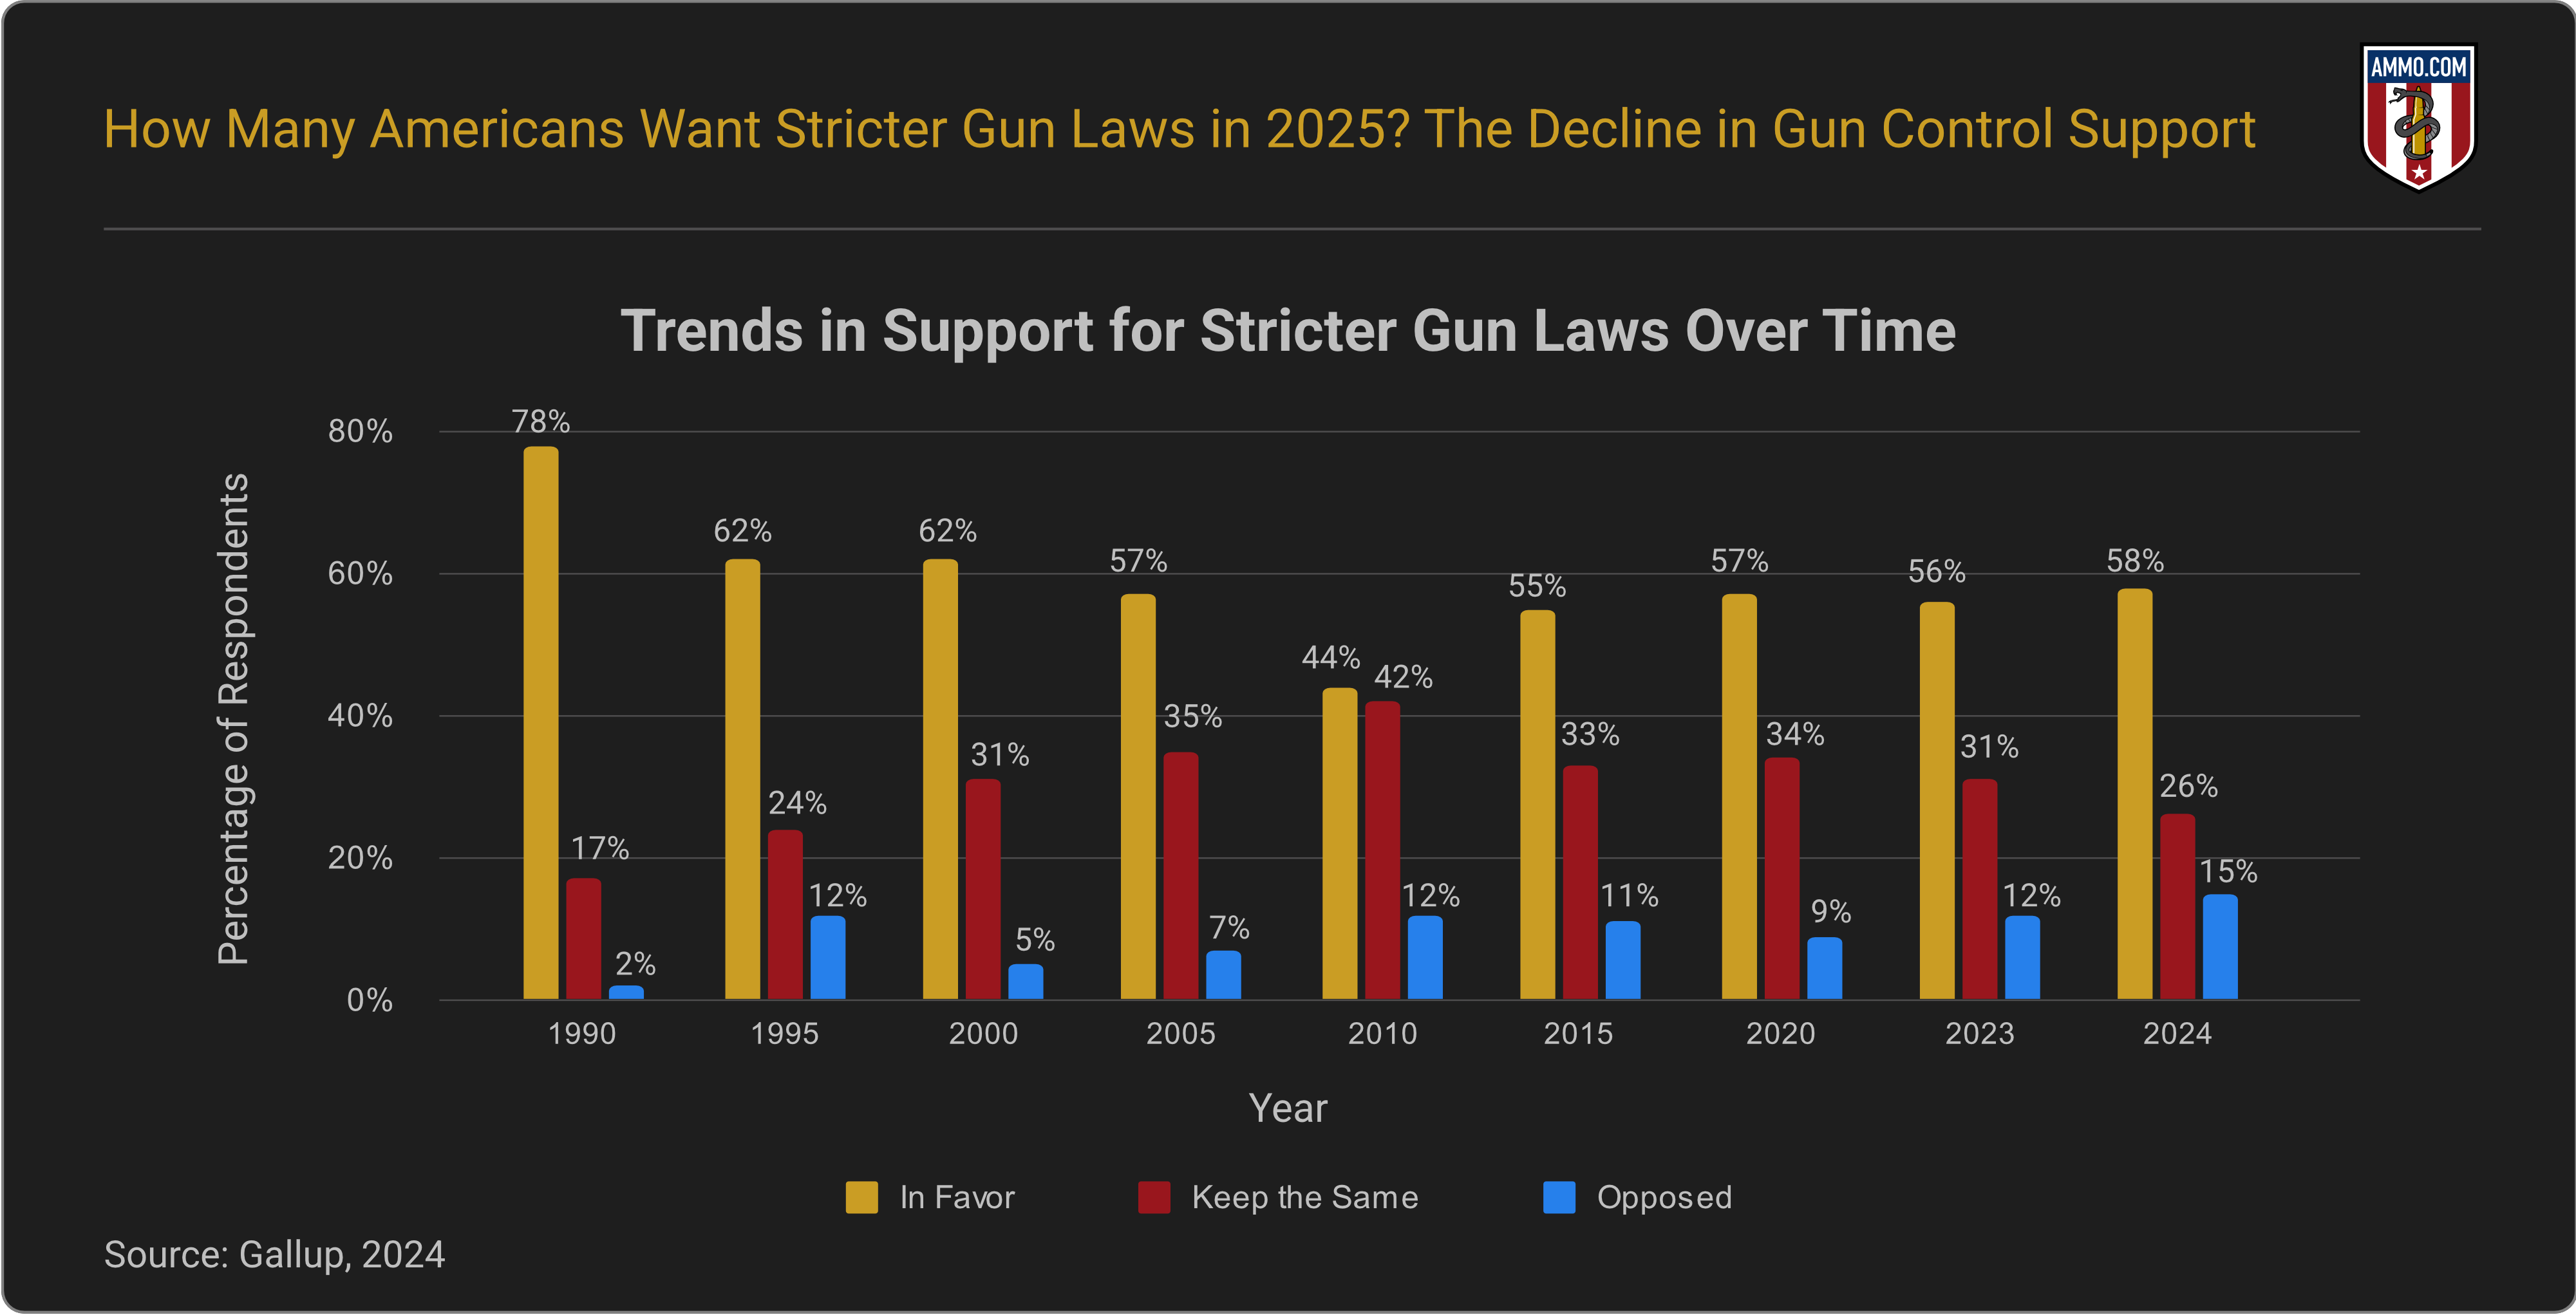
Trends in Support for Stricter Gun Laws Over Time
Support for stricter gun laws has significantly declined over the years, while the desire for more relaxed laws has grown. In 1990, a substantial 78% of Americans favored stricter gun control, with only 2% wanting more lenient regulations. (Gallup, 2024)
By 2010, support for stricter laws had dropped to less than half (44%). However, it rebounded in 2020, rising to 57%. (Gallup, 2024)
In 2023, opposition to gun control reached a two-decade high, with 15% of Americans wanting less strict regulations. Opposition then declined to 10% in 2024. (Gallup, 2024)
Between 2023 and 2025, Johns Hopkins surveys found little to no change in gun control support.
Shifting Perspectives: Growing Resistance to Stricter Gun Control
Gun control remains one of the most debated issues in America.
While younger individuals, women, and those with higher education levels often support stricter regulations, there is significant and growing resistance among other demographics.
Men, older adults, conservative-leaning citizens, and those without a college degree increasingly voice concerns about government overreach and the potential erosion of self-defense rights.
With public opinion becoming more divided and opposition reaching new highs, understanding these dissenting perspectives is essential as the nation navigates this complex and evolving issue.
Sources
- Pew Research Center: Facts About Americans and Guns
- Gallup: Guns
- Gallup: Majority in U.S. Continues to Favor Stricter Gun Laws
- National Survey of Gun Policy

Subscribe for weekly deals and money-saving tips on ammo!
Written by Cassandra McBride
Infographics
- Are Guns & Ammo The New Gold? Why More Americans Are Arming Themselves
- The Greatest Gun Salesman In America: President Barack Obama
- Shooting Straight: How Both Presidential Candidates Have Changed On Gun Control
- President Obama: (Still) The Greatest Gun Salesman in America
- An Inconvenient Truth: How The Obama Administration Became Earth’s Largest Arms Dealer
- Armed Drones: President Obama’s Weapon of Choice
- COVID-19 Data Study: Ammunition Sales Continue to Soar in Response to Coronavirus Panic
- Data Study: 18 Months of Ammo Sales during a Pandemic, Protests, and the Biden Presidency
- Data Study: U.S. Ammo Sales Surge Following Russian Invasion of Ukraine
- Most Gun-Friendly States
- Worst States to be a Gun Owner
- Children & Firearms: Definitions and Demographics Make All the Difference
- Urban Violent Crime & Legal Gun Ownership
- Gun-Free School Zone Laws & School Shootings
- Gun Control Laws and Enforcement Trends
- Gun Ownership by State
- How Many Gun Owners are in America?
- Concealed Carry Crime Stats
- Accidental Shooting Statistics: A Review of Unintentional Firearm Deaths
- America’s Stolen Guns: A Silent Contributor to Gun Crimes in the U.S.
- Gun Violence Statistics: Comprehensive Look at the Data
- Gun Laws vs. Crime Rates: A Comprehensive Analysis
- Gun Death Statistics by Caliber: A Review of Calibers and Crime
- Anti-Gun Control Arguments: Facts Gun Control Lobby Suppress
- Guns in the Home Statistics: The Effects of Firearms in the Home
- Gun Deaths in the US: Analyzing At-Risk Demographics
- How Many Guns in the U.S.: All About America’s Firearms
- Gun Facts in the U.S.: The Reality of Firearms in America
- Defensive Gun Use Statistics: America’s Life-Saving Gun Incidents
- Correlation Between Mass Shootings and Prescription Drugs
- Gun Ownership by Gender: Closing the Gender Gap
- Murders by Weapon Type: Statistics
- Gun Violence Among Black Americans: Statistics
- The Ultimate Hunting Caliber Chart: Best Cartridge Per Species
- How Old Do You Have to be to Buy a Gun: A State Guide
- Most Popular Guns in the U.S.: The Must-Have Guns
- Stray Bullet Deaths: Accident and Injury Statistics
- Mass Shooters by Race: Demographics of Assailants
- Ammunition Limits By State: How Much Ammo Can You Buy?
- Why Do Americans Own Guns?
- How Many Americans Want Stricter Gun Laws?
- How Many Households in the U.S. Have a Gun?
- What Percentage of Gun Deaths are Suicides?
- Average Age of Mass Shooters in the U.S.
- Firearm Ownership in America by Year
- US Firearms Deaths Per Year: A Collective Report
- Percentage of Americans Owning Guns
- Texas Gun Ownership: Total Numbers, Trends, and Most Popular Guns
- Gun Ownership Statistics Colorado: Trends & Numbers
- Hunting Accident Statistics (Causes & Trends Per Year)
- Banned Guns & Ammo List: A Review by State
- 3D Printed Gun Laws By State
- How To Build a Home Shooting Range: The Ultimate Guide
- States With the Highest Murder Rates
- Best Self-Defense Weapons for Women
- Easiest States to Buy a Gun
- Cities with the Lowest Crime Rate
- Oregon Homicide Rates