Report Highlights: Gun violence rates in the U.S. vary depending on demographics, geography, and firearm accessibility and ownership.
- In 2024, the gun violence rate in the U.S. was 4.7 per 100,000 people; a decline from the 2021 peak of 6.5 per 100,000.
- There were 1,399 deaths and 2,184 injuries related to mass shootings between 1966 and May 2026.
- Compared to the same time period in 2024, gun violence in the U.S. declined by 15% in the first half of 2025.
Ammo.com provides accurate and reliable data on a variety of subjects. You can view the sources used in this article HERE.
Related Studies: Gun Laws vs. Crime Rates: 2026 Statistics & Laws | What Percentage of Gun Deaths Are Suicides? | Cities With the Lowest Crime Rates
Methodology
Gun violence (defined as the intentional injuring of another human with a firearm) statistics exclude self-inflicted gunshot wounds and unintentional shootings. Although conversation worthy, shootings that do not include interpersonal violence do not represent a consistent threat to the general public. Legal intervention and operations of war were included in this report, as these types of shootings do involve violence by definition. Homicides and justifiable homicides were also included in this report.
Mass shooting (defined as a shooting incident with four or more fatalities excluding the perpetrator or perpetrators) statistics exclude dispute-related, gang-related, or family violence-related events. These types of violence pose a threat to the general public, whereas other shooting incidents with multiple victims are typically targeted toward specific individuals.
All gun death data were drawn from the CDC WONDER database, which compiles death certificate data from all U.S. counties. The most updated death data from 2025 are partial and incomplete; these rates will change as more information is collected.
Gun Violence Statistics in 2026
According to data from the Gun Violence Archive, 4,845 gun deaths and 8,129 gunshot injuries (including homicide, murder, and defensive gun uses) were reported in the U.S. between January and May of 2026.
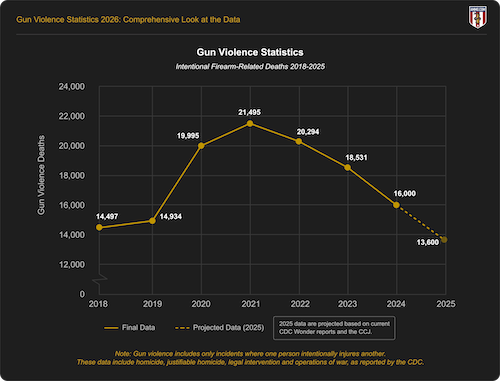
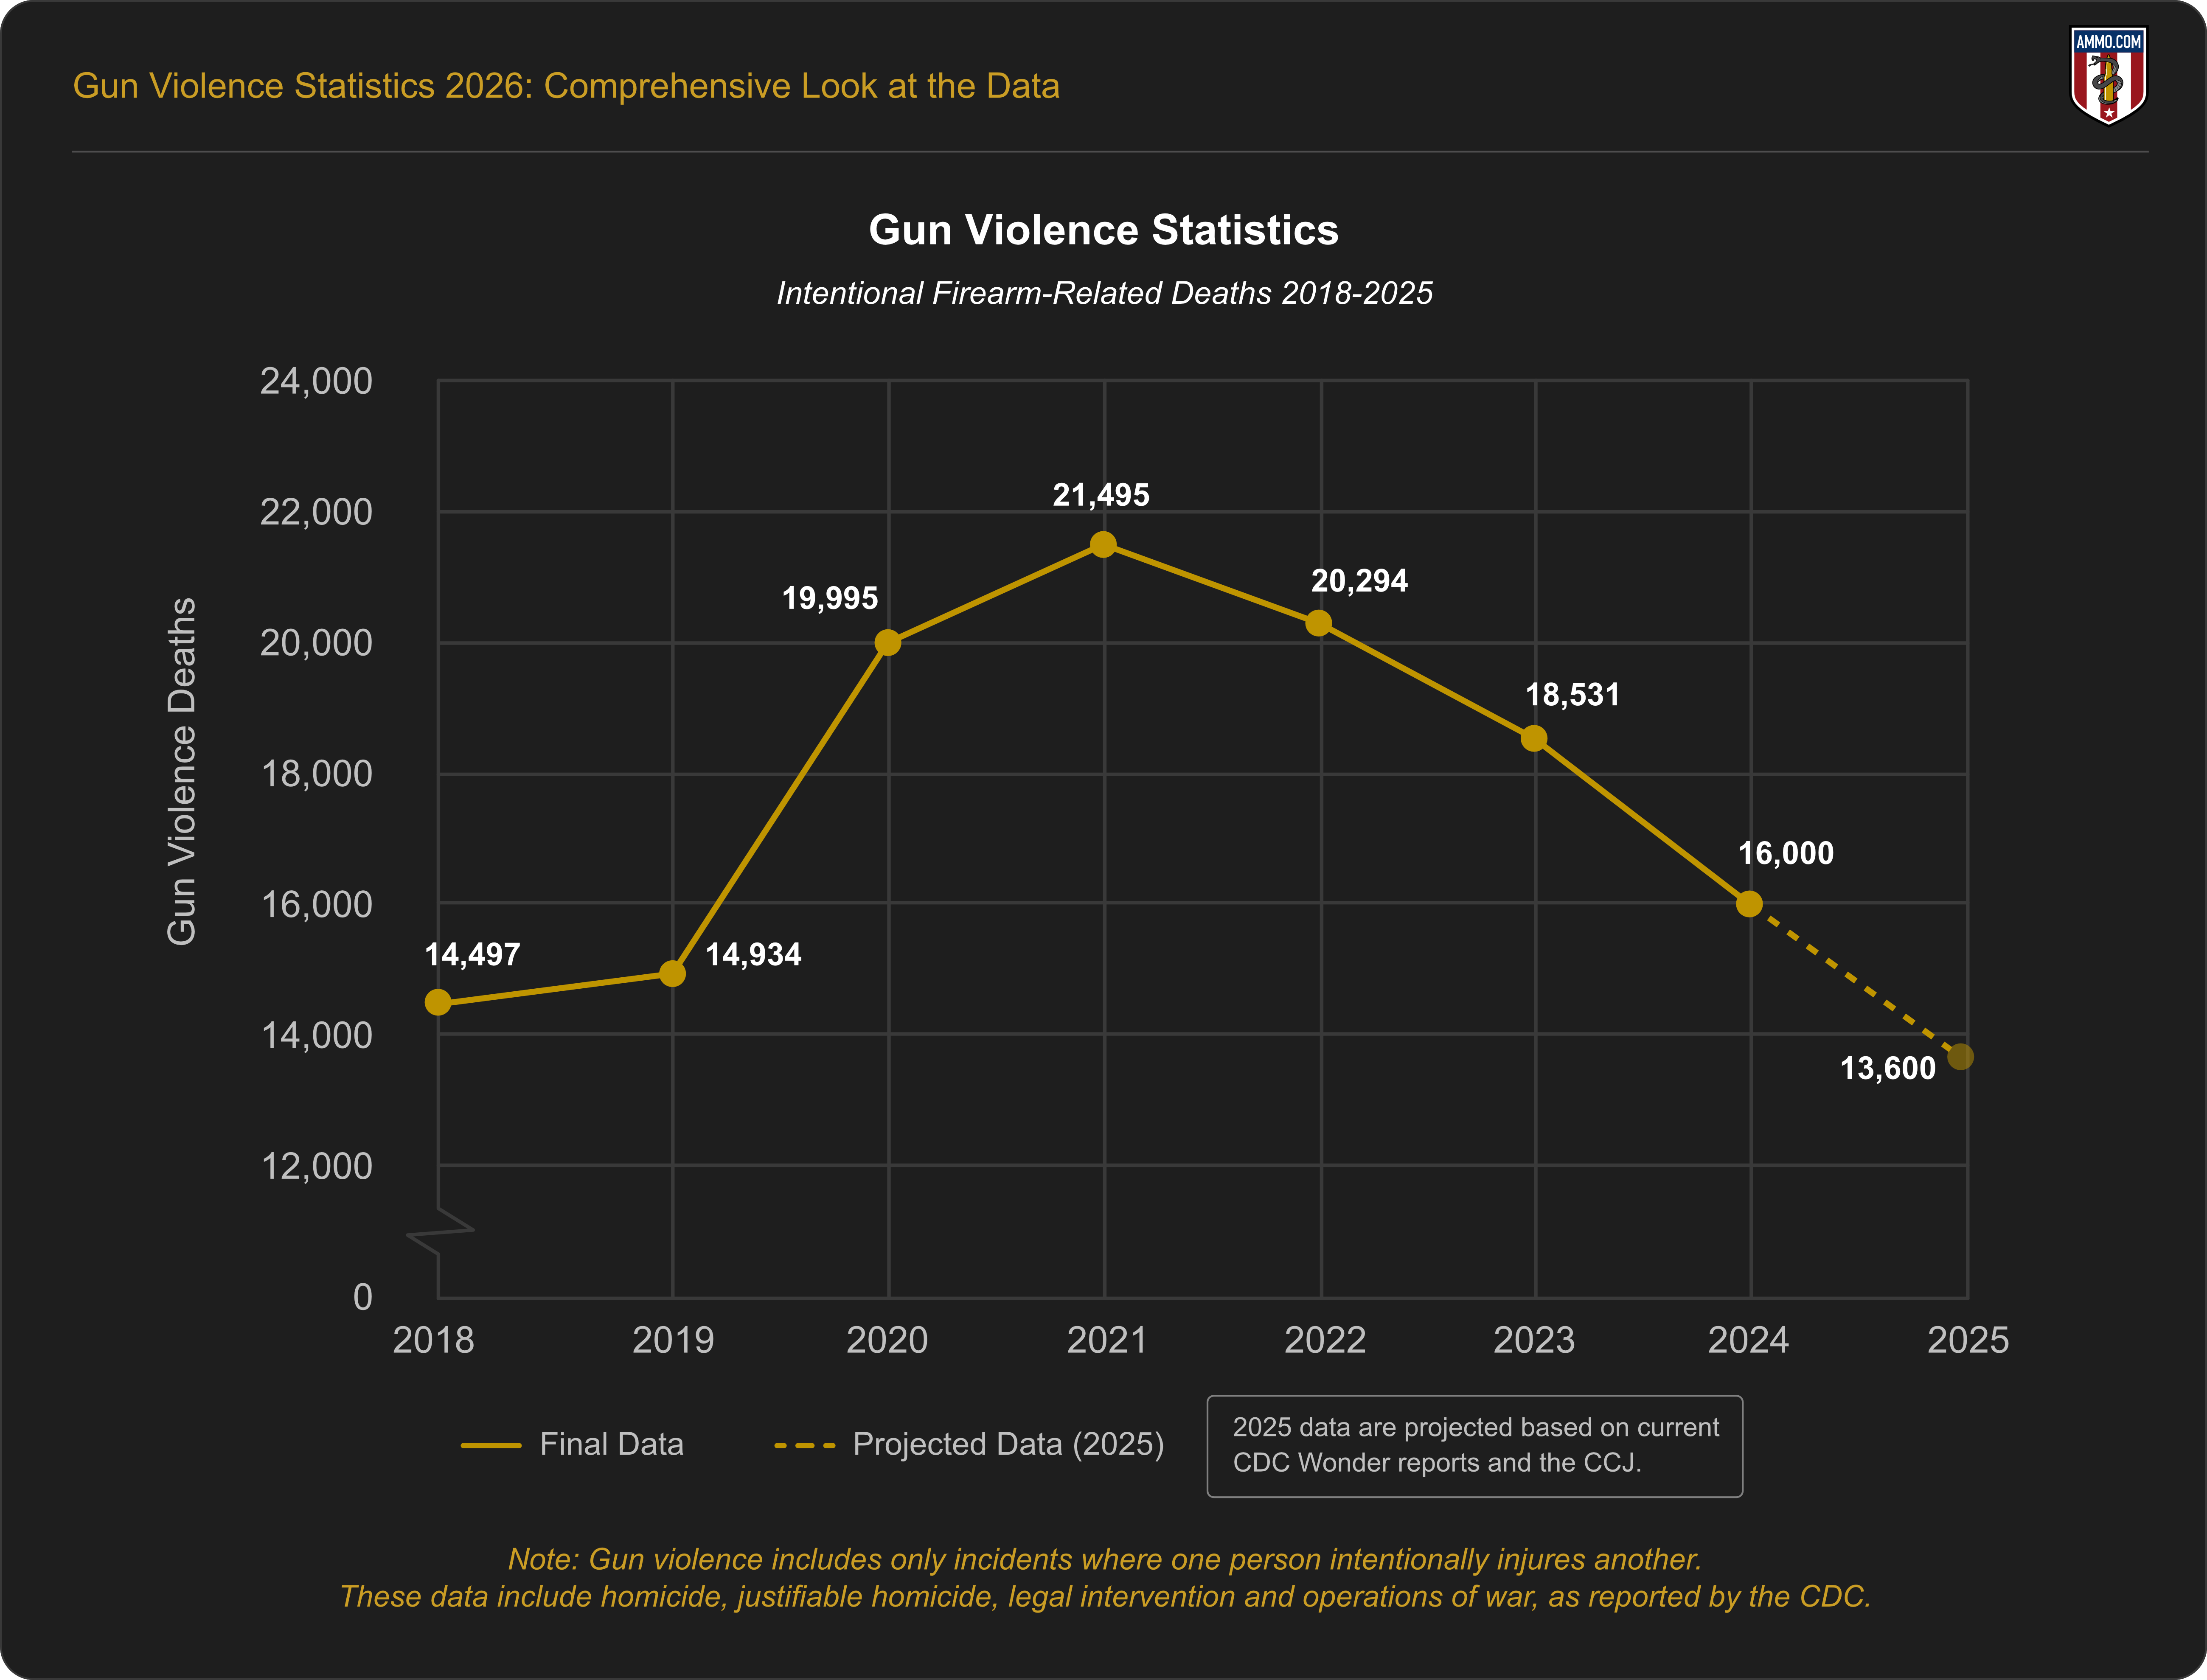
Gun violence in the U.S. increased substantially through 2020 and 2021, then began declining in 2022. While the rate of decline was slow, it began falling more sharply in 2024 and into 2025.
Although the CDC WONDER database does not have complete 2025 death data in 2026, the first half of the year is trending lower for firearm-related deaths (excluding suicides) than in previous years. Data between January and June of 2025 were relatively stable compared to previous years in 2026, when CDC WONDER reported 6,899 gun violence deaths.
For proper comparison, gun violence from January through June of each year was analyzed, as (A) gun deaths tend to increase during summer months, and (B) those data were unreliable for 2025 and 2026 due to partial reporting.
Gun violence increased by 1% from 2018 to 2019, and 37% from 2019 through June 2020. The increase slowed in 2021 to 8%, and then declined by 2% during the first six months of 2022 (compared to the same period in 2021). The first six months of 2024 saw a 13% decline, followed by a 15% decline in 2025.
Gun Violence and Gun Ownership Statistics
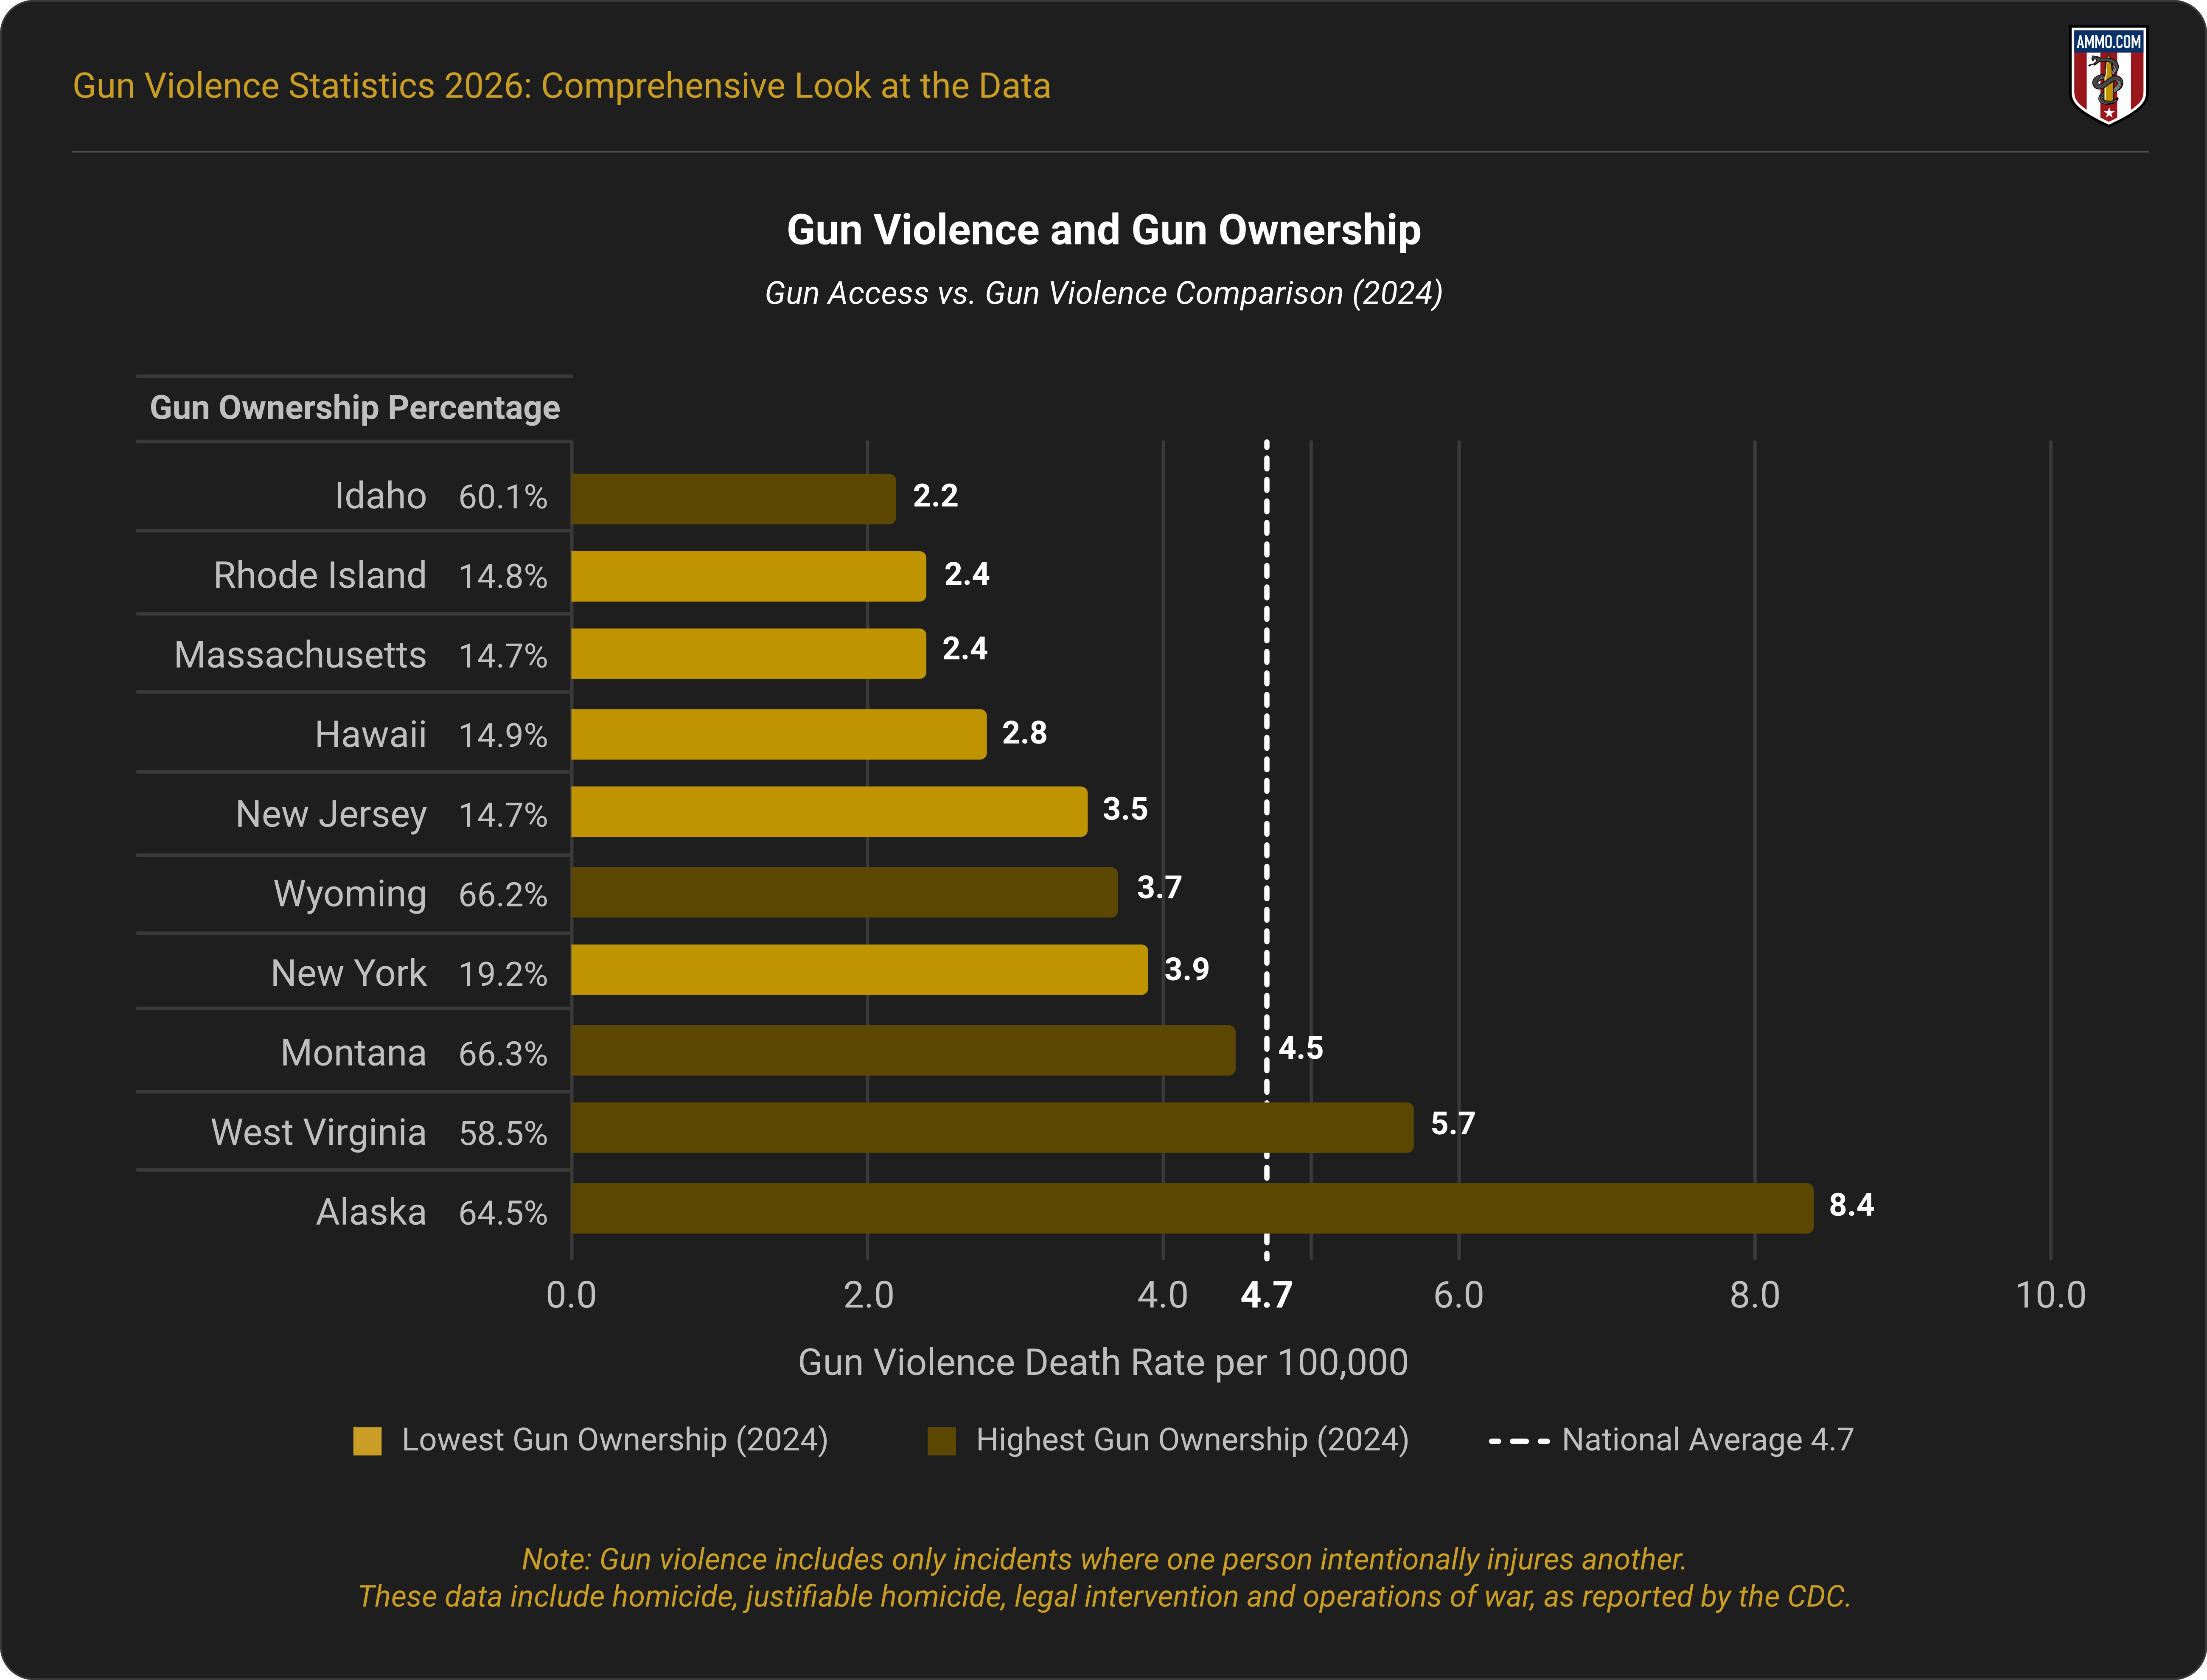
States with the highest rates of gun ownership have small populations, but also had a gun violence rate of 2.6 per 100,000 people compared to 1.7 per 100,000 in states with the lowest gun ownership rates. (Source 2, 3, 7)
Alaska (64.5 guns per 100 residents), Idaho (60.1 per 100), Montana (66.3 per 100), West Virginia (58.5 per 100), and Wyoming (66.2 per 100) had the highest reported rates of gun ownership in 2024. States with the highest gun ownership accounted for 2.6% (1,184) of the 44,447 firearm-related deaths in the U.S. in 2024 (81.5% of which were suicides). Gun violence rates among high ownership states ranged from 2.2 deaths per 100k (Idaho) to 8.4 per 100k (Alaska) in 2024.
Hawaii (14.9 guns per 100 residents), Massachusetts (14.7 per 100), New Jersey (14.7 per 100), New York (19.2 per 100), and Rhode Island (14.8 per 100) had the lowest reported rates of gun ownership. These states accounted for 3.8% of gun deaths in 2024, with 38.7% being attributed to homicide. Gun violence rates in lower ownership states ranged from 2.4 deaths per 100k (Massachusetts and Rhode Island) to 3.9 per 100,000 (New York) in 2024.
In 2024, Louisiana (12.3 deaths per 100,000 residents) and Mississippi (16.1 per 100,000) had the highest gun violence rates in the U.S. These states had a gun ownership rate of 53.1 per 100 and 55.8 per 100, respectively.
Illinois (7.0 deaths per 100,000 residents) and Maryland (6.5 deaths per 100,000) also had high homicide rates, but low firearm ownership: 27.8 per 100 and 30.2 per 100, respectively.
Gun Violence Deaths by Year in the U.S.
Gun violence deaths have fluctuated significantly since the CDC began consistently tracking deaths in 1979. Although the long-term trend shows an overall decline in the past 40 years, rates spiked to 7.0 deaths per 100,000 in 1980 and peaked at 7.1 per 100,000 in 1991 and 1993. Rates spiked again to 6.1 per 100,000 in 2020, and spiked again to 6.5 per 100,000 in 2021. (Source 2, 3)
In the mid-1980s, gun violence rates declined to 5.1 homicides per 100,000 people before rising to all-time highs in 1991 and 1993. A sustained decline began in 1999 when rates initially lowered to 4.0 per 100,000. Rates remained low during the 2010s at 3.7 to 4.6 per 100,000, before spiking again in 2020.
In 2024, the U.S. gun violence rate was 4.7 per 100,000: 27.7% lower than the 2021 peak. Provisional data from 2025 show an additional 15% decline in gun violence death totals from the same period in 2024, with the Council on Criminal Justice projecting a rate of 4.0 per 100,000. (Source 4)
Mass Shootings Statistics
Between 1966 and 2026, there were 1,399 deaths and 2,184 injuries related to 205 mass shootings in the U.S. (defined as four fatalities not including the shooter, and unconnected to another crime or familial violence). Incidents, fatalities, and injuries increased significantly between the 1980s and 1990s before peaking in the 2010s, and then slowly declined in the 2020s. (Source 5, 6)
| Period | Incidents/Year | Killed/Year | Injured/Year |
|---|---|---|---|
| 1966–1979 | 1.1 | 6.5 | 6.5 |
| 1980–1989 | 2.3 | 15.0 | 14.8 |
| 1990–1999 | 3.7 | 21.3 | 21.8 |
| 2000–2009 | 3.6 | 23.0 | 16.4 |
| 2010–2019 | 5.4 | 50.7 | 136.3* |
| 2020–2025 | 5.2 | 34.7 | 33.3 |
*2017 includes the Route 91 festival shooting in Las Vegas which caused 60 fatalities and 867 injuries. Excluding that single shooting reduces the fatality rate to 44.7 and the injury rate to 49.6 per year in the 2010s.
Mass shooters are predominantly male (97.5% of shooters), with two female and two transgender perpetrators on record. Mass shooters have ranged in age from 12 to 72 years old, with 34 being the average age. Five of the ten deadliest mass shootings were committed by individuals in their 20s. The majority of shootings were carried out by 28-year-olds.
White Americans accounted for 56.9% of mass shooters in targeted attacks between 1966 and May 2026. Black Americans accounted for 21.3%.
Gun Violence by Demographics
Between 2018 and 2024, non-Hispanic black persons accounted for the highest rate of gun violence victims in the U.S. (24.8 per 100,000). Non-Hispanic Native Americans accounted for the second highest rate of gun violence victims (8.3 per 100,000), followed by Hispanic white persons (5.1 per 100,000).
Non-Hispanic white persons died from gun violence at a rate of 2.0 per 100,000, while Asians died at a rate of 1.0 to 1.1 per 100,000 (includes non-Hispanic and Hispanic, respectively).
Individuals aged 20 through 29 accounted for the highest rate of gun violence victims between 2018 and 2025 (partial), with 11.5 and 10.5 deaths per 100,000, respectively. Adults aged 30 through 34 accounted for the third highest gun violence rate (9.3 per 100,000), followed by adolescents aged 15 through 19 (8.9 per 100,000).
Partial data from 2025 suggest that all races experienced a decline from a gun violence spike in 2020 through 2022. The gun violence death rate of black people declined by 16% in 2025; Native Americans, 19%; white Americans, 15%; Hispanic Americans, 16% (4.9 to 4.1 per 100,000). (Source 2, 3)
Wrap-Up
Gun violence rates declined in the late 1990s and spiked again in 2020, but have been steadily declining since 2022. Mass shooting rates declined in the 2020s after peaking in the 2010s. Gun violence disproportionately affected certain races and ethnicities during those time periods.
Trends in gun ownership across states do not support a strong correlation between violence and ownership.
Sources
- Gun Violence Archive: 2026
- CDC WONDER: Underlying Cause of Death (2018-2024)
- CDC WONDER Provisional Mortality Statistics (2018-2026)
- Crime Trends in U.S. Cities: Year-End 2025 Update
- The Violence Project: Mass Shooter Database
- U.S. Mass Shootings, 1982-2026: Data From Mother Jones’ Investigation
- RAND: Gun Ownership in America
Subscribe for weekly deals and money-saving tips on ammo!
Last Updated: Jun 22, 2026 Original here: https://ammo.com/articles/gun-violence-statistics