by Dan Mitchell
I regularly share reports that measure how states rank for economic policy.
- Economic Freedom of North America
- Freedom in the 50 States
- State Business Tax Climate Index
- State income taxes
- State sales taxes
- State budgetary burdens
Now we can augment this collection.
A website called Money Geek has issued a report, authored by Jeff Ostrowski, which ranks states that are most friendly and least friendly to a hypothetical middle-class family.
This map has the details. The best states (led by Wyoming, Nevada, and Alaska) are dark blue, while the worst states (led by Illinois, Connecticut, and New Jersey) are dark grey.
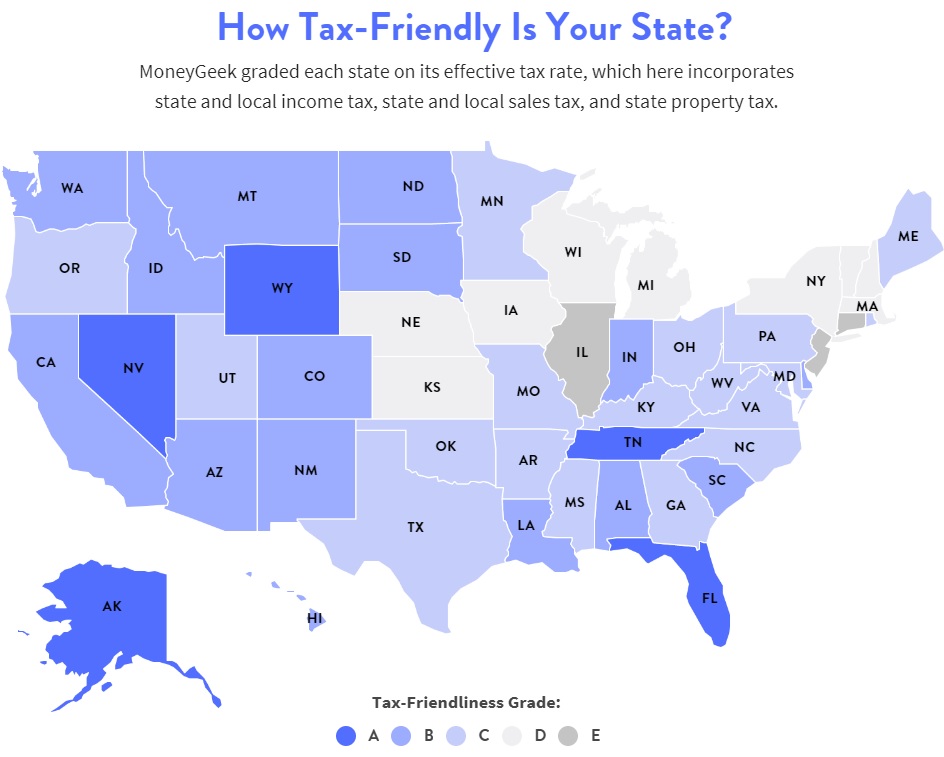
Here are some of the main findings, including the fact that people “vote with their feet” by moving to low-tax states.
Illinois has the highest tax burden in the U.S., with an estimated tax amount of $13,894 for the hypothetical family. Wyoming only imposes approximately $3,279 for the same family, making it the top state in terms of tax-friendliness. 4 out of 5 of the most tax-friendly states saw population growth at or above the national average (Wyoming, Nevada, Florida and Tennessee). Illinois and Connecticut received a grade of E for being the least tax-friendly states in the nation. Illinois experienced a population decline, while Connecticut’s population grew by just 0.1% — lower than the national average of 0.2%.
Interesting results. First and foremost, we have more evidence that Illinois is a basket case.
And it has a governor who wants to make a bad situation even worse.
I also think it’s worth noting that all the best states have no income tax.
The reports has lots of interesting data, but it doesn’t tell us everything we should know.
Before I explain why the numbers should be taken with a grain of salt, read the report’s methodology.
To calculate the least and most tax-friendly states, we researched income, sales and property tax rates by state. Using expenditure and income data from the Bureau of Labor Statistics’ Consumer Expenditure Survey, we constructed a hypothetical family with one dependent, gross income of $82,852, and a home worth $349,400 (the median new home price at the time we conducted our research). We then estimated the state taxes this hypothetical family would pay in each state. We ranked the states based on…the size of the tax payment.
There’s nothing wrong with this methodology, assuming the goal is simply to measure the tax burden on a particular type of household.
But if the goal is to rank tax systems, there are three reasons why the report is incomplete or misleading.
First, it is not a measure of how tax systems affect economic performance. The most bizarre results in the report is that California, with a very punitive, class-warfare tax system, ranks above Texas, which has no income tax.
Why is this misleading? Because it’s important not only to measure how much of a family’s income is grabbed by government, but also whether a government has policies that make it more difficult to earn money in the first place.
In other words, there’s a reason that taxpayers and businesses are moving from California to Texas, notwithstanding the results from Money Geek.
Second, it doesn’t tell us anything about whether states are providing good services in exchange for the taxes that are being collected.
In an ideal world, states would use tax revenues to finance genuine “public goods.” In reality, taxes often are used to funnel undeserved money to powerful constituencies such as state and local bureaucrats.
And it’s worth noting that there are big differences in how states perform on basic functions such as education, infrastructure, and crime control (and the same is true for cities).
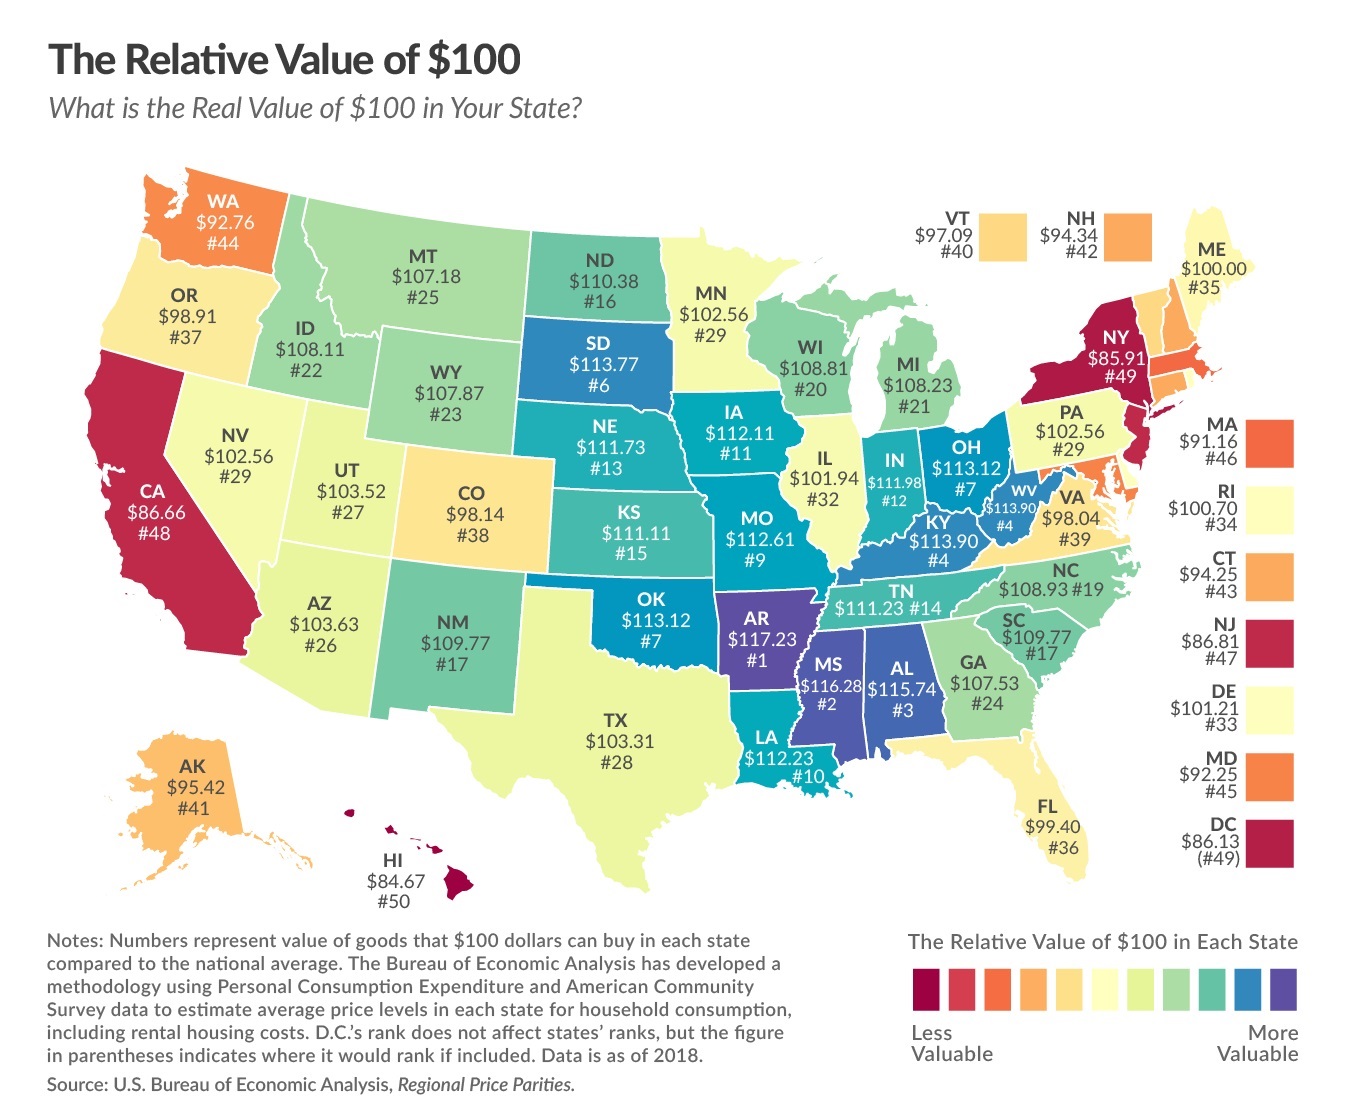
Third, it is not adjusted for the cost of living in different states. A family in Nebraska with a $350,000 house and about $83,000 of income obviously lives much better than a similar family in New Jersey. Why? Because money goes much farther in states with a lower cost of living.
This map from the Tax Foundation shows that red and orange states can be much more expensive than green and blue states.
P.S. If you want a ranking of economic liberty for metropolitan areas, click here.
P.P.S. Click here if you want a ranking of states based on occupational licensing (a form of employment protectionism).