We’re looking at two studies today. The first from the veteran research company Pew Research and the other from Smart Asset. They are both fascinating and reveal how the economic landscape for people and families is shifting beneath us.
The share of adults who live in middle-class households fell from 61% in 1971 to 50% in 2021, according to a new Pew Research Center analysis of government data.
The shrinking of the middle class has been accompanied by an increase in the share of adults in the upper-income tier – from 14% in 1971 to 21% in 2021 – as well as an increase in the share who are in the lower-income tier, from 25% to 29%. These changes have occurred gradually, as the share of adults in the middle class decreased in each decade from 1971 to 2011, but then held steady through 2021.
The share of aggregate U.S. household income held by the middle class has fallen steadily since 1970. The widening of the income gap and the shrinking of the middle class has led to a steady decrease in the share of U.S. aggregate income held by middle-class households. In 1970, adults in middle-income households accounted for 62% of aggregate income, a share that fell to 42% in 2020.
Meanwhile, the share of aggregate income accounted for by upper-income households has increased steadily, from 29% in 1970 to 50% in 2020. Part of this increase reflects the rising share of adults who are in the upper-income tier.
The share of U.S. aggregate income held by lower-income households edged down from 10% to 8% over these five decades, even though the proportion of adults living in lower-income households increased over this period.
Click on the story below to read all of the PRC findings.
Another study by SmartAsset calculated the lower and upper bounds of what it takes to be middle-class in 100 American cities across all 50 states and found that one area particularly dominated the rankings: Five of the top 10 cities with the highest middle-class ceilings were tech cities.
Key Findings
- Northeastern salaries are about 20% higher than Southern salaries — even after accounting for cost of living differences. The Northeast dominates the top 10 highest middle class salary ranges, with many middle class salaries between $60,000 to $170,000. Meanwhile, that same middle class bracket falls between about $35,000 to $100,000 in many Southern states. While the top-placing Northeastern states cost roughly 50% more to live in than the low-ranking Southern states, the middle class salary range sits about 70% higher2.
- The middle class in NYC aren’t making enough to keep up with the cost of living. While other notoriously pricey cities like San Francisco and Seattle have a middle class income that trends closely with the general cost of living, New York City wages lag behind. While the middle class wage range was middle of the road of all cities examined, the cost of living in Queens, Brooklyn and Manhattan are 43%, 70% and 138% higher than the national average, respectively.
- Middle class status is hardest to attain in tech cities. Three out of the top five cities with the highest income thresholds for the middle class are located in the San Francisco Bay Area in California. These middle income residents need to make at least $81,623 in San Francisco, $84,673 in San Jose and $104,499 in Fremont. Seattle residents similarly need to make at least $74,223.
- You’re middle class even if you make $310,000 in this California city. Households that earn up to $311,936 per year in Fremont, California, are still technically considered middle class. That’s the highest ceiling for any city in our study – Fremont’s median household income ($155,968) is almost $30,000 more than the next highest city.
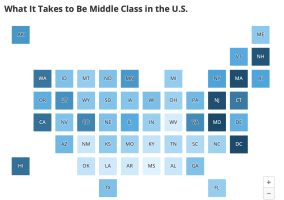
What It Takes to Be Middle Class in the 50 States
Maryland, Washington D.C. and Massachusetts have the three highest floors for the middle class at a statewide level. In all three places, it takes an annual income of more than $60,000 for households to be considered middle class. New Jersey ($59,828) and New Hampshire ($59,272) round out the top five.
At the other end of the spectrum, Mississippi is the state that requires the lowest annual income to be a part of the middle class ($32,640). The Magnolia State is followed by West Virginia ($34,336), Louisiana ($34,898), Arkansas ($35,194) and Alabama ($36,122).