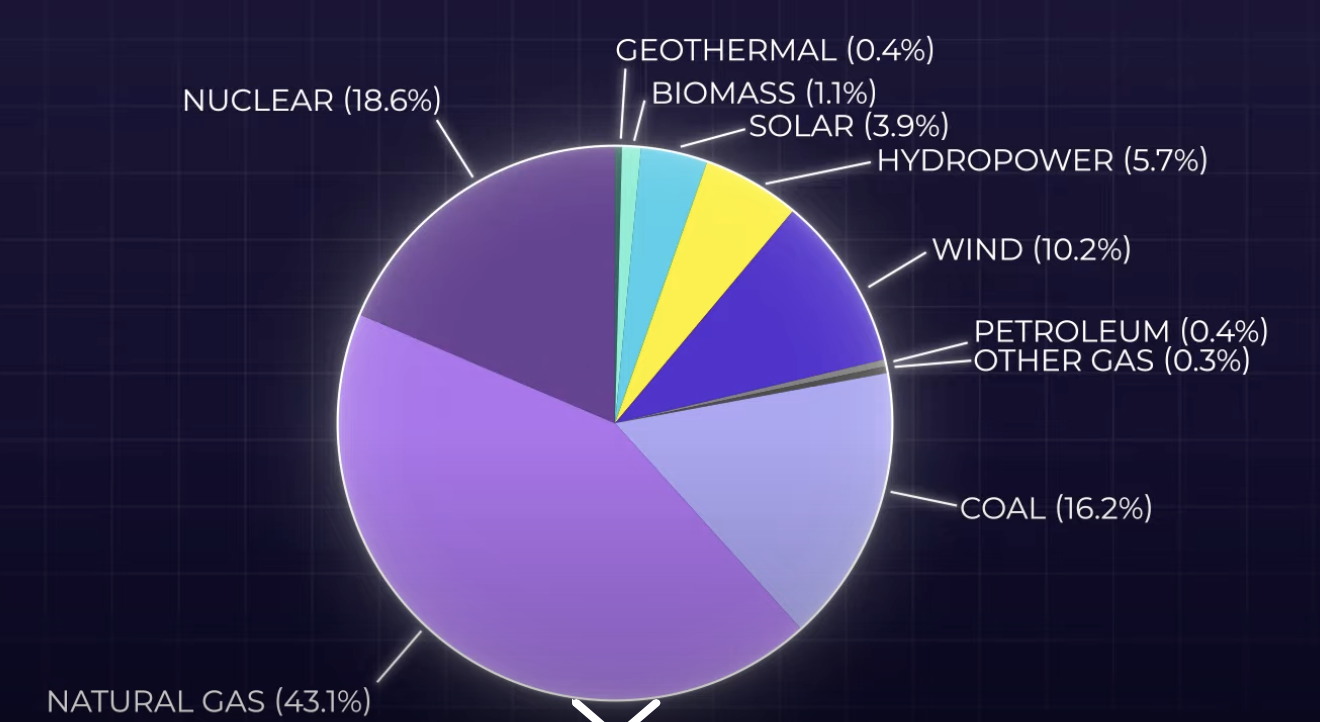
What is U.S. electricity generation by energy source?
In 2023, about 4,178 billion kilowatthours (kWh) (or about 4.18 trillion kWh) of electricity were generated at utility-scale electricity generation facilities in the United States.1 About 60% of this electricity generation was from fossil fuels—coal, natural gas, petroleum, and other gases. About 19% was from nuclear energy, and about 21% was from renewable energy sources.
The U.S. Energy Information Administration estimates that an additional 73.62 billion kWh of electricity generation was from small-scale solar photovoltaic systems in 2023.2
U.S. utility-scale electricity generation by source, amount, and share of total in 2023
| Energy source | Billion kWh | Share of total |
|---|---|---|
| Total – all sources | 4,178 | |
| Fossil fuels (total) | 2,505 | 60.0% |
| Natural gas | 1,802 | 43.1% |
| Coal | 675 | 16.2% |
| Petroleum (total) | 16 | 0.4% |
| Petroleum liquids | 12 | 0.3% |
| Petroleum coke | 5 | 0.1% |
| Other gases3 | 11 | 0.3% |
| Nuclear | 775 | 18.6% |
| Renewables (total) | 894 | 21.4% |
| Wind | 425 | 10.2% |
| Hydropower | 240 | 5.7% |
| Solar (total) | 165 | 3.9% |
| Photovoltaic | 162 | 3.9% |
| Solar thermal | 3 | 0.1% |
| Biomass (total) | 47 | 1.1% |
| Wood | 31 | 0.8% |
| Landfill gas | 8 | 0.2% |
| Municipal solid waste (biogenic) | 6 | 0.1% |
| Other biomass waste | 2 | 0.1% |
| Geothermal | 16 | 0.4% |
| Pumped storage hydropower4 | -6 | -0.1% |
| Other sources5 | 10 | 0.2% |
| Data source: U.S. Energy Information Administration, Electric Power Monthly, February 2024; preliminary data | ||
| 1 Utility-scale electricity generation is electricity generation from power plants with at least one megawatt (or 1,000 kilowatts) of total electricity generating capacity. Data are for net electricity generation. 2 Small-scale solar photovoltaic (PV) systems are electricity generators with less than one megawatt (MW) of electricity generating capacity, which are not connected at a power plant that has a combined capacity of one MW or larger. Most small-scale PV systems are at or near the location where the electricity is consumed and many are net metered systems. Smaller PV systems are usually installed on building rooftops. 3 Other gases includes blast furnace gas and other manufactured and waste gases derived from fossil fuels. 4 Pumped storage hydroelectricity generation is negative because most pumped storage electricity generation facilities use more electricity than they produce on an annual basis. Most pumped storage systems use electricity from an electric power grid for pumping water to the storage component of the system. 5 Other (utility-scale) sources includes non-biogenic municipal solid waste, batteries, hydrogen, purchased steam, sulfur, tire-derived fuel, and other miscellaneous energy sources. | ||
Learn more:
Electric Power Monthly: Chapter 1: Net Generation
Electric Power Annual: Chapter 3: Net Generation
Monthly Energy Review: Electricity
Energy Explained: Electricity in the United States
Last updated: February 29, 2024, with data from the Electric Power Monthly, February 2024. Data are preliminary for 2023.
