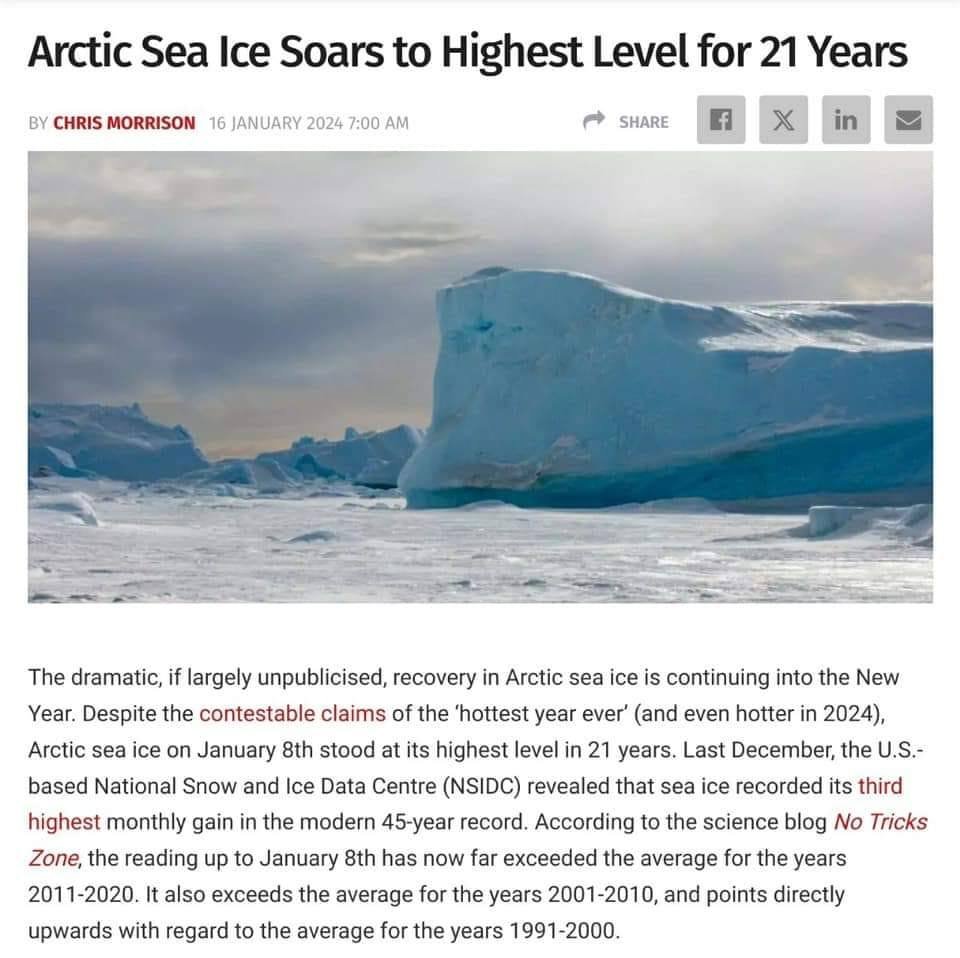
Oops. How inconvenient for the "climate crisis" narrative. pic.twitter.com/OZAj3llqmD
— Wide Awake Media (@wideawake_media) July 31, 2024
Note also that the NSIDC claims the January growth extent was “below average”. Well it depends on what average you are using. The NSIDC uses a comparative average from 1981-2010, despite a more recent decade of data being available. It is not hard to see why it prefers 1981-2010 since it includes the higher levels of the 1980s and excludes the lower levels of the 2010s. Taking a 1991-2020 average would likely lead to many more ‘above average’ observations. Data before 1979 is not as accurate, but levels going back to the 1950s suggest much lower sea ice extents. Perish the thought that comparisons should be made with these data or observations made about an obvious cyclical trend seen here and in the historical record going back to the early 1800s. Daily Sceptic
“Worst ever” always depends when you measure from…
The heatwave of 1921 was global, and brought millions of people to the brink of starvation.#ClimateScam https://t.co/l2iYX0bRG5 https://t.co/urUQNNyl4t pic.twitter.com/eAkA50G7M0
— Tony Heller (@TonyClimate) August 1, 2024
That same year (1921) Encinal, Texas recorded 157 consecutive days over 90F https://t.co/ncysx0mT6X pic.twitter.com/SSjQMa04V4
— Tony Heller (@TonyClimate) August 1, 2024
