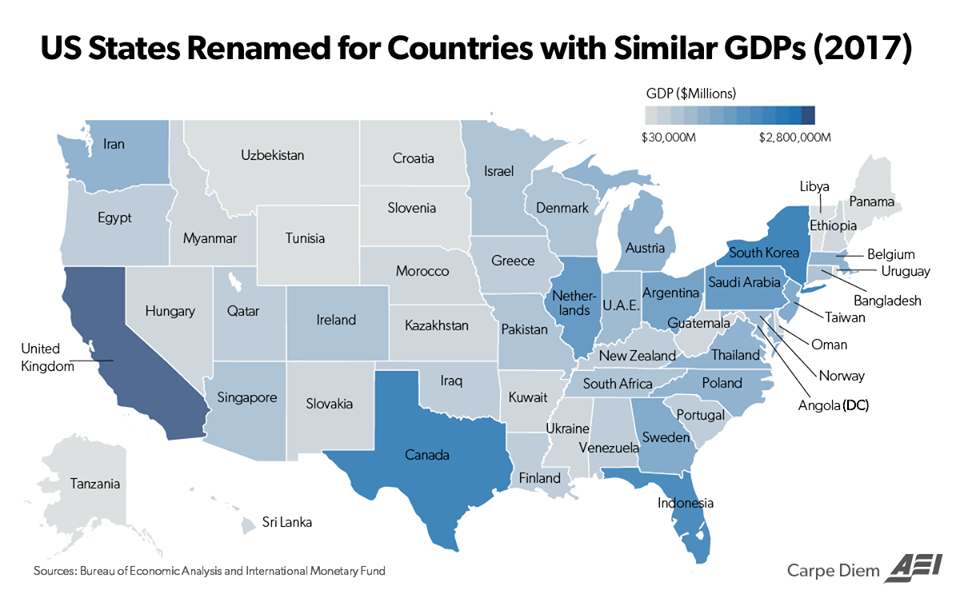
Putting America’s enormous $19.4T economy into perspective by comparing US state GDPs to entire countries
How important was international trade for each US state’s economy in 2017? The map and table above help to answer that question. The table above shows GDP for each US state (data here) in 2017 (based on an average of the second and third quarter figures, data for Q4 aren’t yet available), the total trade volume (exports + imports, data here for merchandise trade only, data on trade in services aren’t available by state) last year, and the volume of international trade activities as a share of each state’s GDP, ranked from highest to lowest. Ignoring the District of Columbia, the average trade share of GDP for US states in 2017 was 17.2% (up from 16.7% in 2016), and ranged from a low of 5% for South Dakota to a high of 39% for Michigan. The trade shares by state are also displayed graphically in the map above — the greater the share of state trade activities (exports + imports) in relation to state GDP, the darker the shade of blue.
Following No. 1 Michigan as America’s most globalized state, the states with the next highest trade shares in 2017 were Louisiana (38.7%), Kentucky (38.1%), Tennessee (32.6%), South Carolina (31.9%), Texas (31.2%) and Indiana (25.7%). Overall, the trade share of GDP was 20% or higher in one-third (17) of states last year, 25% or higher in ten US states, and 30% or higher in six states.
For some thoughts on the US states with the highest international trade shares in 2017, and the policy implications of those trade shares please click here.


