Report Highlights
Hunting is a great American pastime. Unfortunately, human error, equipment malfunctions, and medical emergencies lead to hundreds of accidents each year.
- 464 Accidents per year, 2010–2024On average, 464 hunting accidents and 61.3 hunting fatalities were reported annually between 2010 and 2024.
- Hunter judgment (42.9%) and skill and aptitude factors (40.8%) were the most common causes of hunting-related incidents in that same time span.
- Firearm discharges accounted for a larger share of incidents than tree stand falls (34.0% vs. 24.5%), but the two shared similar fatality rates (10.5% vs. 11.0%).
Methodology and Definitions
This report covers hunting “accidents” and “incidents.” Both refer to any unintended event occurring during hunting activities such as weapon discharges, falls, equipment failures, medical emergencies (heart attack, drowning, etc.), regardless of whether the event resulted in injury or death.
The primary data source for this article is the International Hunter Education Association (IHEA) Hunting Incident Database. It is a comprehensive list of incident reports voluntarily submitted by state wildlife agencies. This database is not a complete inventory of every hunting-related accident, but it is the most detailed incident-level dataset publicly available.
Different figures in this report use different denominators, which is intentional rather than inconsistent. Where a casualty type, lighting condition, weapon type, or self-inflicted status was not provided for a specific incident, that datum was excluded from the relevant calculation rather than assumed to fall into any category.
Several figures in this article required determining why and how an incident occurred, and then further classification. When an incident did not have available information, it was excluded from that portion of the report. For example, information was lacking in some incidents as to whether a firearm was the source of injury. Such incidents were excluded.
Incidents in this report were classified as confirmed firearm discharges if they met at least one of the criteria below, based on fields in the IHEA database:
- State Classification of Incident – Contains the exact text “discharge of firearm”
- Shooter Projectile Type – Contains “bullet,” “shot,” or “slug”
- Incident Summary – Contained language related to discharged, discharge, went off, gun/rifle/shotgun/pistol fired, accidentally/unintentional fired, trigger [pull/catch/caught], shot rang out, struck by, shot in, shot himself/herself, GSW, or gunshot wound.
An incident was then excluded, regardless of previous factors, if the summary contained: heart attack, cardiac, drowned/drowning, ATV flipped/crash, hypothermia, medical emergency, natural causes, or snake bite.
Where IHEA’s database did not contain relevant information, external sources were used. External sources were also used to support plausible trends in our findings.
How Many Hunting Accidents Per Year in the U.S.?
Between 2010 and 2025, IHEA reported 7,068 hunting incidents and 929 hunting-related fatalities in the U.S. The number of hunting accidents increased from 602 to 644 between 2010 and 2012, then declined to 313 in 2024. Although the data are incomplete for 2025, the number of hunting accidents and fatalities continued to decline. 1
Hunting Incidents and Fatalities Per Year, 2010–2025
Year Incidents Fatalities
2010 602 71
2011 646 89
2012 644 61
2013 616 63
2014 539 53
2015 537 73
2016 474 78
2017 428 63
2018 365 73
2019 336 49
2020 415 63
2021 355 56
2022 337 47
2023 357 44
2024 313 37
2025 *Partial 104 9
What Are the Main Causes of Hunting Accidents?
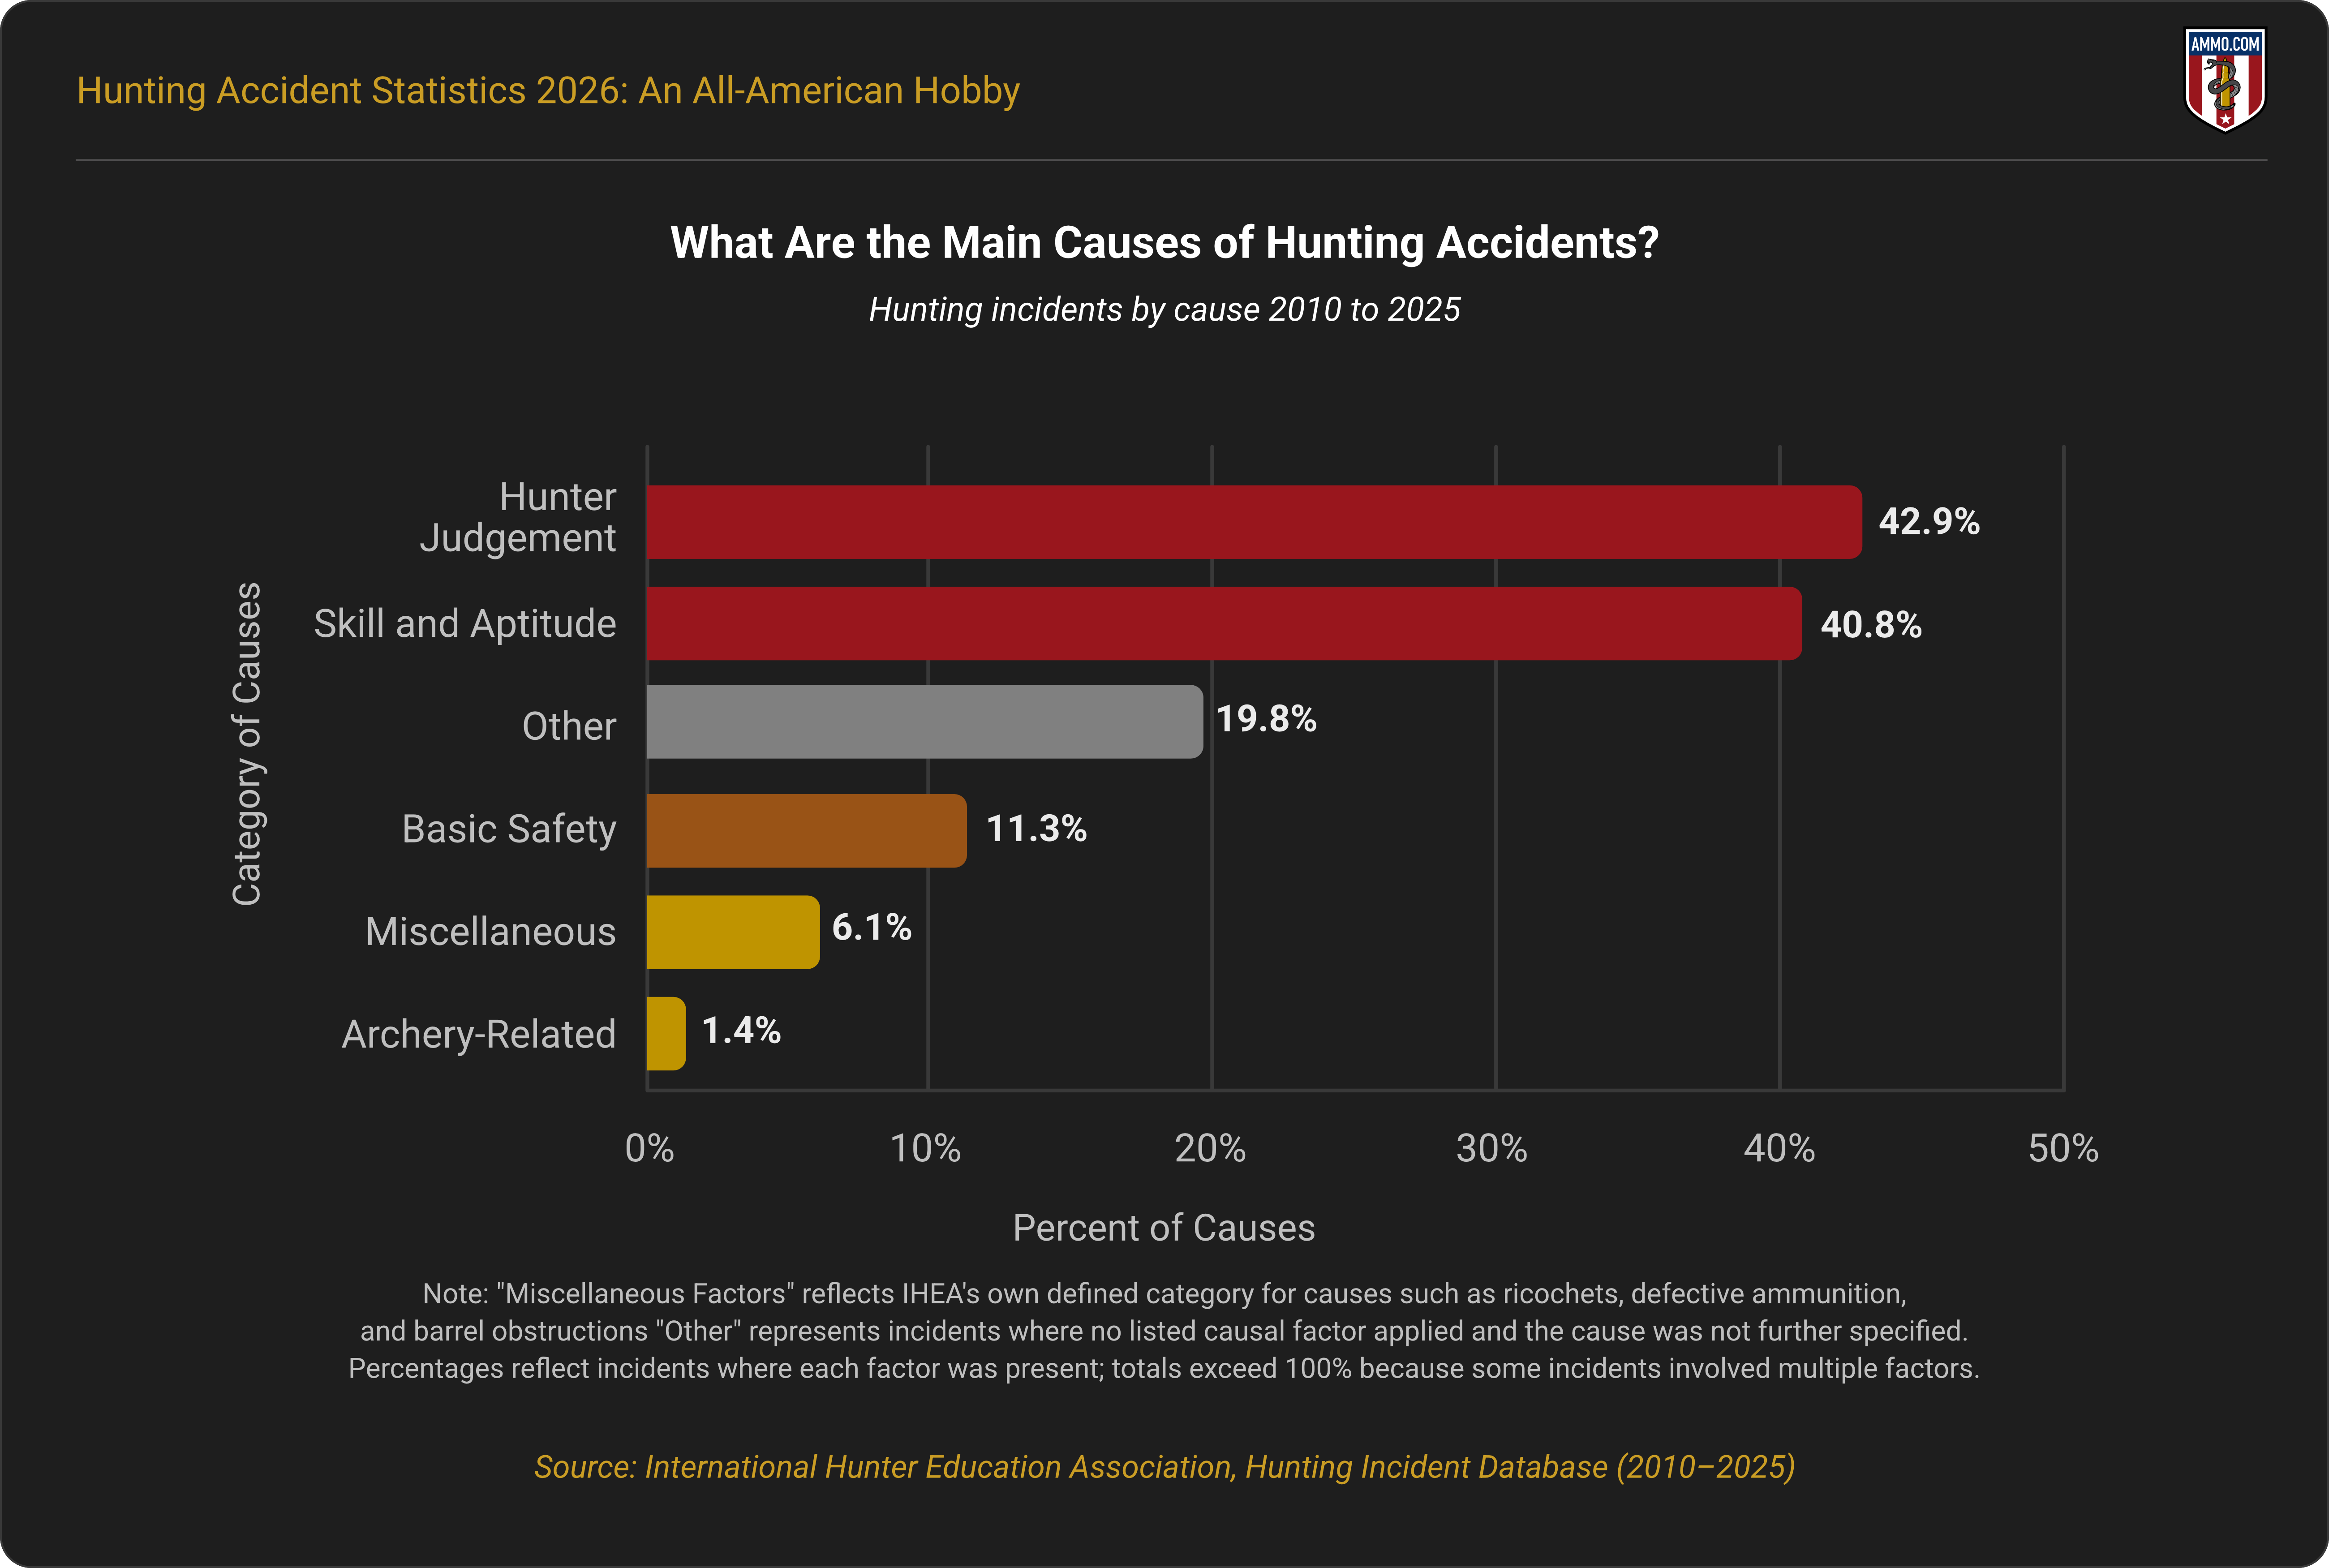
Some sources suggest that 80% of hunting accidents are attributable to human error. 10The IHEA database listed 4,484 incidents with human errors as causal factors. Of those, 1,924 (42.9%) were hunter judgment factors (failure to identify a target, firing while another person was out of sight, etc.).
Skill and aptitude factors, which include careless or reckless handling of a firearm, stumbling and falling, or trigger obstruction, accounted for 1,831 incidents (40.8%). Basic safety and law violations, such as discharging a firearm from a vehicle or shooting across a roadway, accounted for 508 incidents (11.3%).
Other factors include archery-specific accidents, which accounted for 64 incidents (1.4%); “miscellaneous,” including ricochets and defective ammunition, 272 incidents (6.1%); and incidents classified as “other” at 886 incidents (19.8%).
For incidents where a round travels well beyond its intended target, see our data on stray bullet deaths.
Gun-Related Accidents
Between 2010 and 2025, the IHEA Hunting Incident Database lists 2,404 confirmed firearm-discharge incidents. Of those incidents, 10.5% (252) resulted in fatalities.
Other studies examined gun-related hunting fatalities in Canada, Switzerland, and the U.S., which also suggest that 10% of such accidents result in fatalities.
Hunting is one slice of a much wider picture. For unintentional firearm deaths across every setting, see our review of accidental shooting statistics.
Falls From Tree Stands
Some sources estimate that between 3,000 and 4,000 injuries result from tree stand falls each year in the U.S. and Canada combined. The majority of serious injuries (95%) occurred while hunters weren’t wearing harnesses.
According to the IHEA database, roughly 24.5% (1,732) of reported hunting accidents involved a fall from an elevated hunting position such as a tree stand or ladder stand.
According to the Mayo Clinic, most falls from a tree stand occur at 15 feet, which can cause serious injury.
Severity of Hunting Accidents
The cumulative average of hunting accidents between 2010 and 2024 was 464 incidents per year (excluding 2025 partial data). There were more than 15 million hunters in the U.S. in 2023. This means that an estimated 0.003% of all hunters were injured or killed due to hunting accidents each year (2010 to 2024).
Non-Fatal Accidents
Non-fatal hunting accident statistics vary depending on data collection methodology. The IHEA database reported 5,904 non-fatal hunting incidents between 2010 and 2025. However, this may undercount the number of accidents, as some incidents list no casualty type.
Fatal Accidents
Between 2010 and 2025, the IHEA database identified 6,833 hunting accidents with a casualty type. Of those, 929 (13.6%) resulted in fatalities. These fatalities were caused by varying factors, including mishandling of firearms, tree stand falls, and other accidents.
Self-Inflicted Accidents
Between 2010 and 2025, the IHEA database lists 6,087 incidents where “self-inflicted” status was recorded. Of those, 2,580 (42.4%) were self-inflicted accidents.
Two-Party Accidents
The IHEA database lists 3,506 incidents where one hunter injured another from 2010 to 2025. This equates to 57.6% of all hunting accidents where “self-inflicted” status was recorded, with “no” indicating a two-party accident. According to this data, two-party accidents are more common than self-inflicted ones.
Hunting Gun Accidents by Type of Weapon
Of the 929 IHEA-reported fatal incidents (2010-2025) where the casualty type was listed, only 270 fatalities were confirmed to result from a weapon discharge. Weapons, such as shotguns, rifles, bows, and crossbows accounted for 217 incidents, while the remaining 53 incidents involved a handgun (10), an unspecified firearm type (8), or did not have the weapon-type recorded (35).
For a wider look at how caliber choice figures into firearm deaths beyond the hunting field, see our review of gun death statistics by caliber.
Shotgun
Shotguns accounted for 84 (38.7%) weapon-related hunting fatalities in the U.S. between 2010 and 2025. 1
For a breakdown of what each load is built to do before you head afield, see our guide to shotgun shell types.
Rifle
Rifles accounted for the largest share of weapon-related hunting fatalities in the U.S. between 2010 and 2025, with 126 deaths (58.1%).
For a species-by-species look at what to carry, see our guide to the best caliber for deer hunting.
Bow and Arrow
Between 2010 and 2025, there was only one confirmed incident of a bow-related fatality in the IHEA database. Crossbows accounted for six confirmed fatalities.
Common Injury Locations in Hunting Accidents
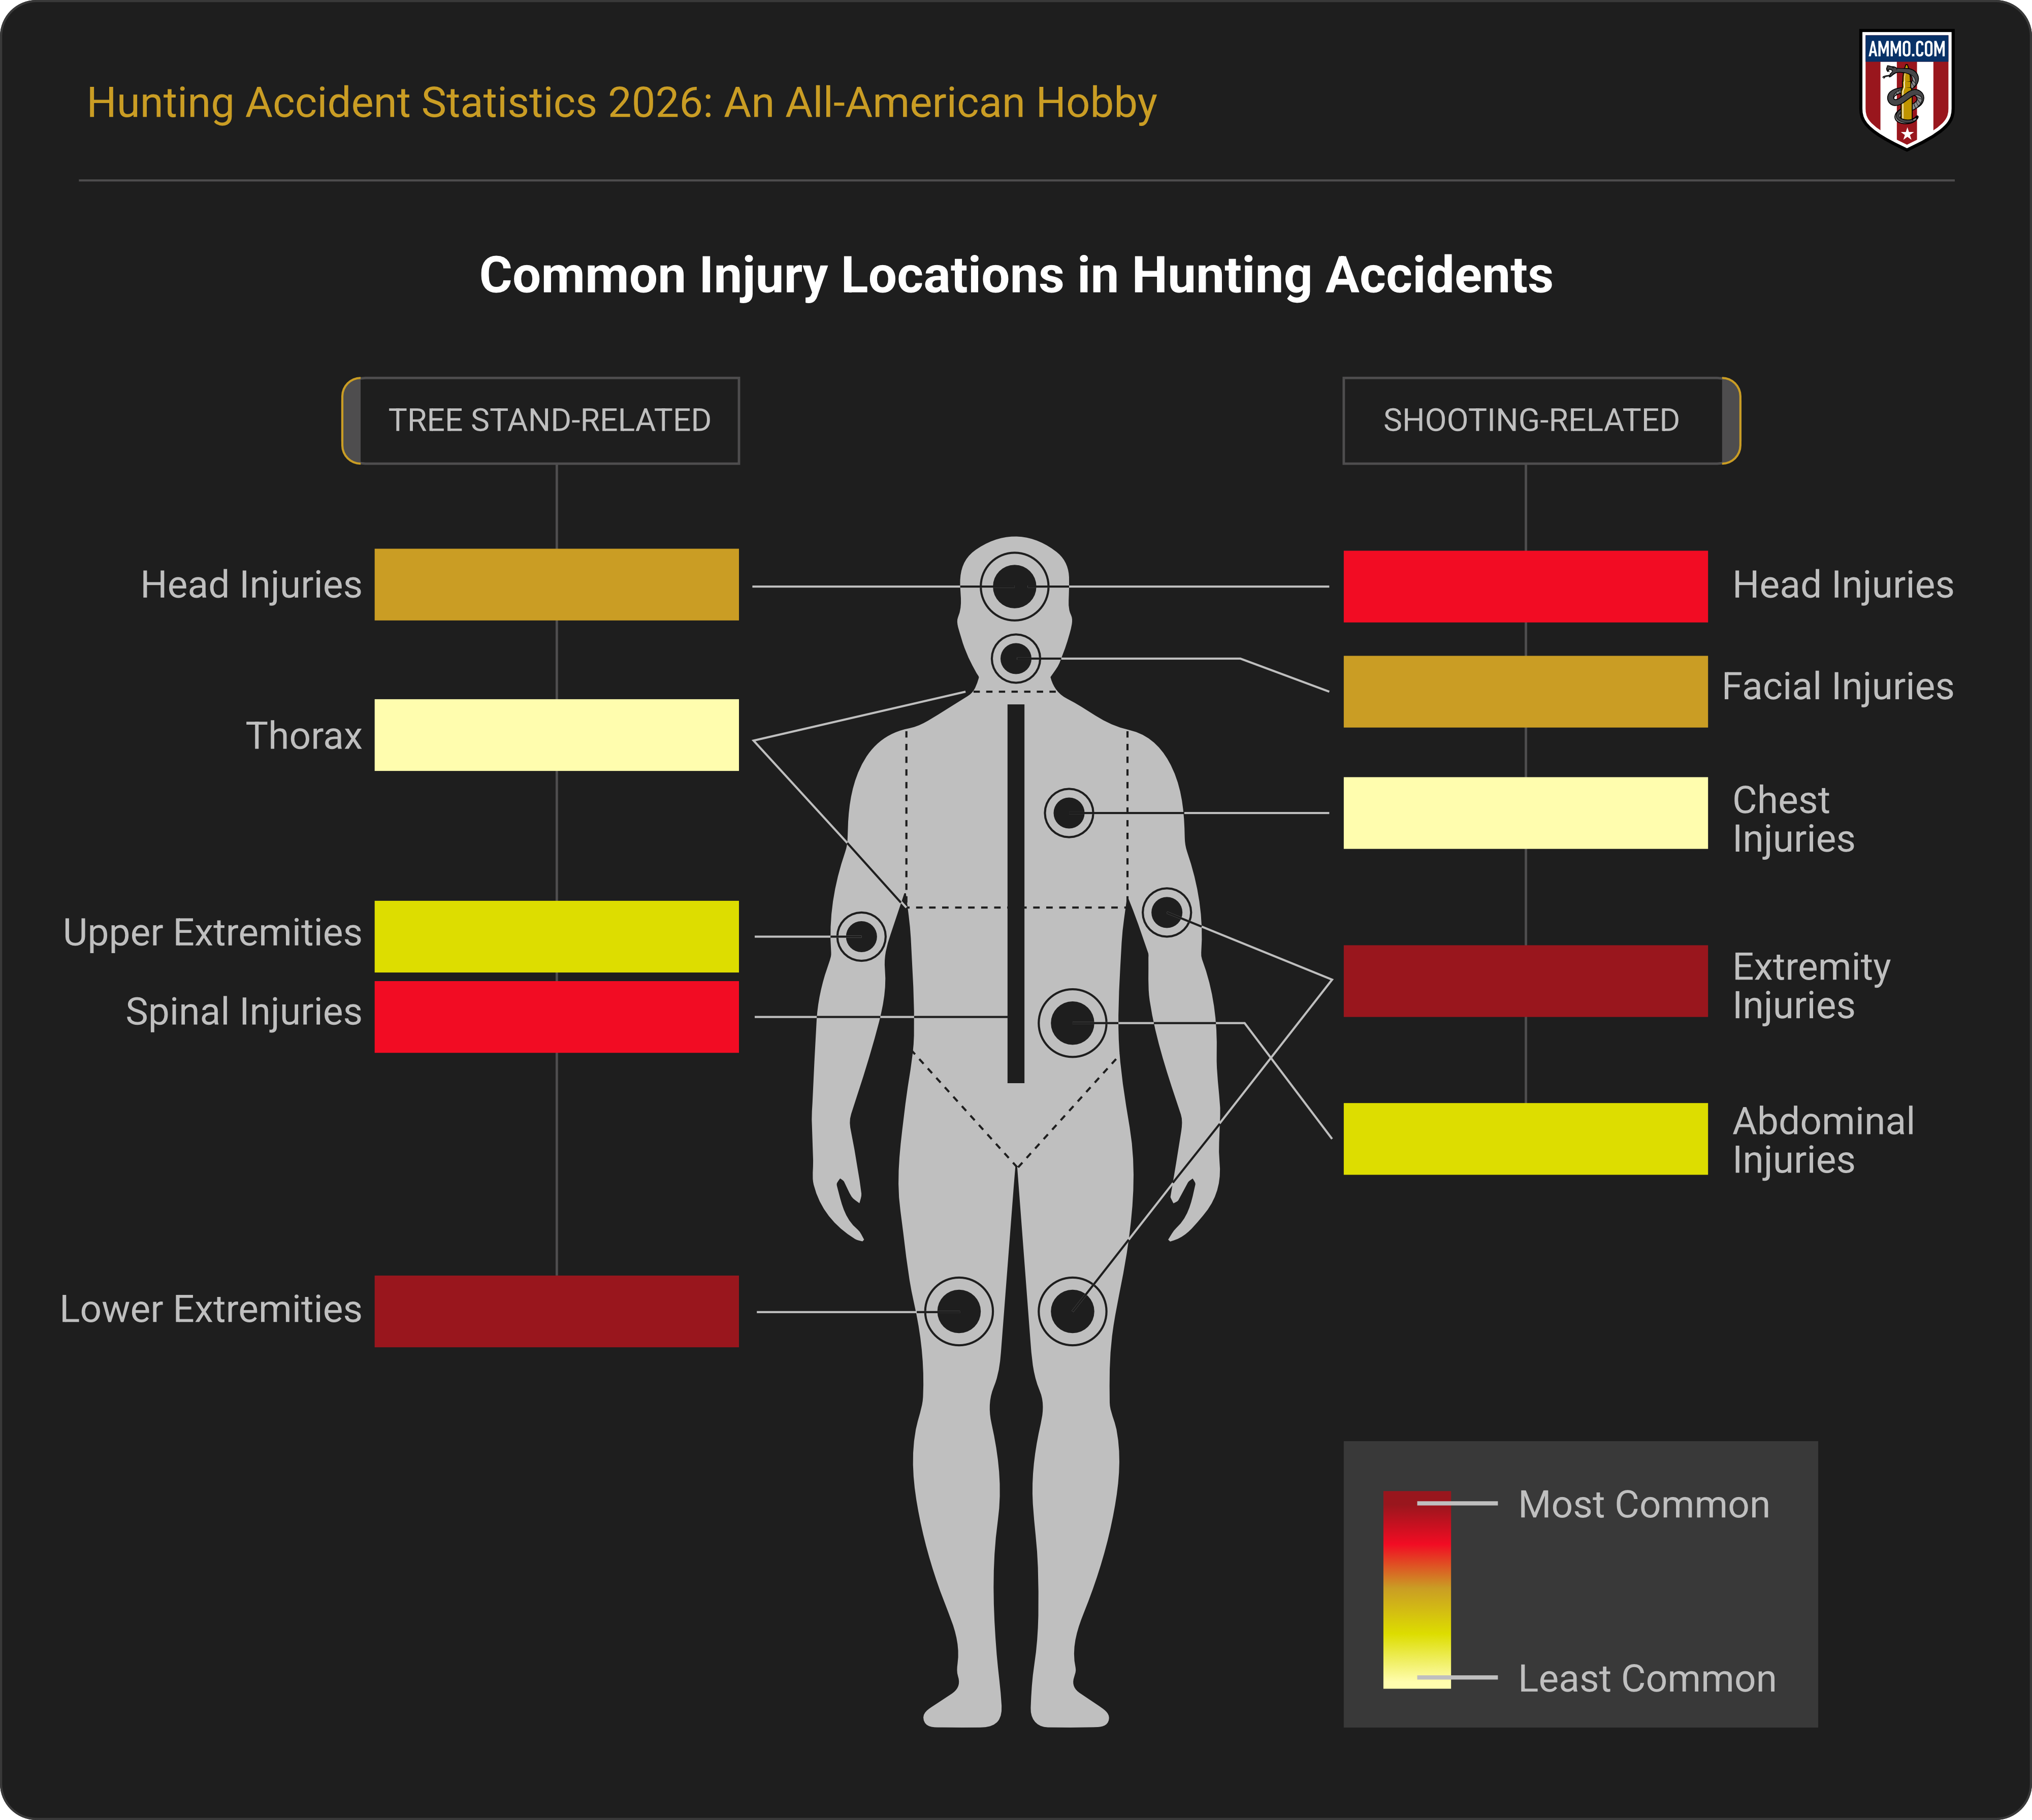
Hunting accidents most often result from tree stand falls, which commonly cause spinal cord injuries, head injuries, and broken bones.
Injuries to the lower extremities are most common in non-fatal hunting accidents, and are often attributed to falls, knives, bullets, arrows, and bolts. Injuries to the head and abdomen are most likely in firearm-related hunting fatalities.
When Do Incidents Usually Happen?
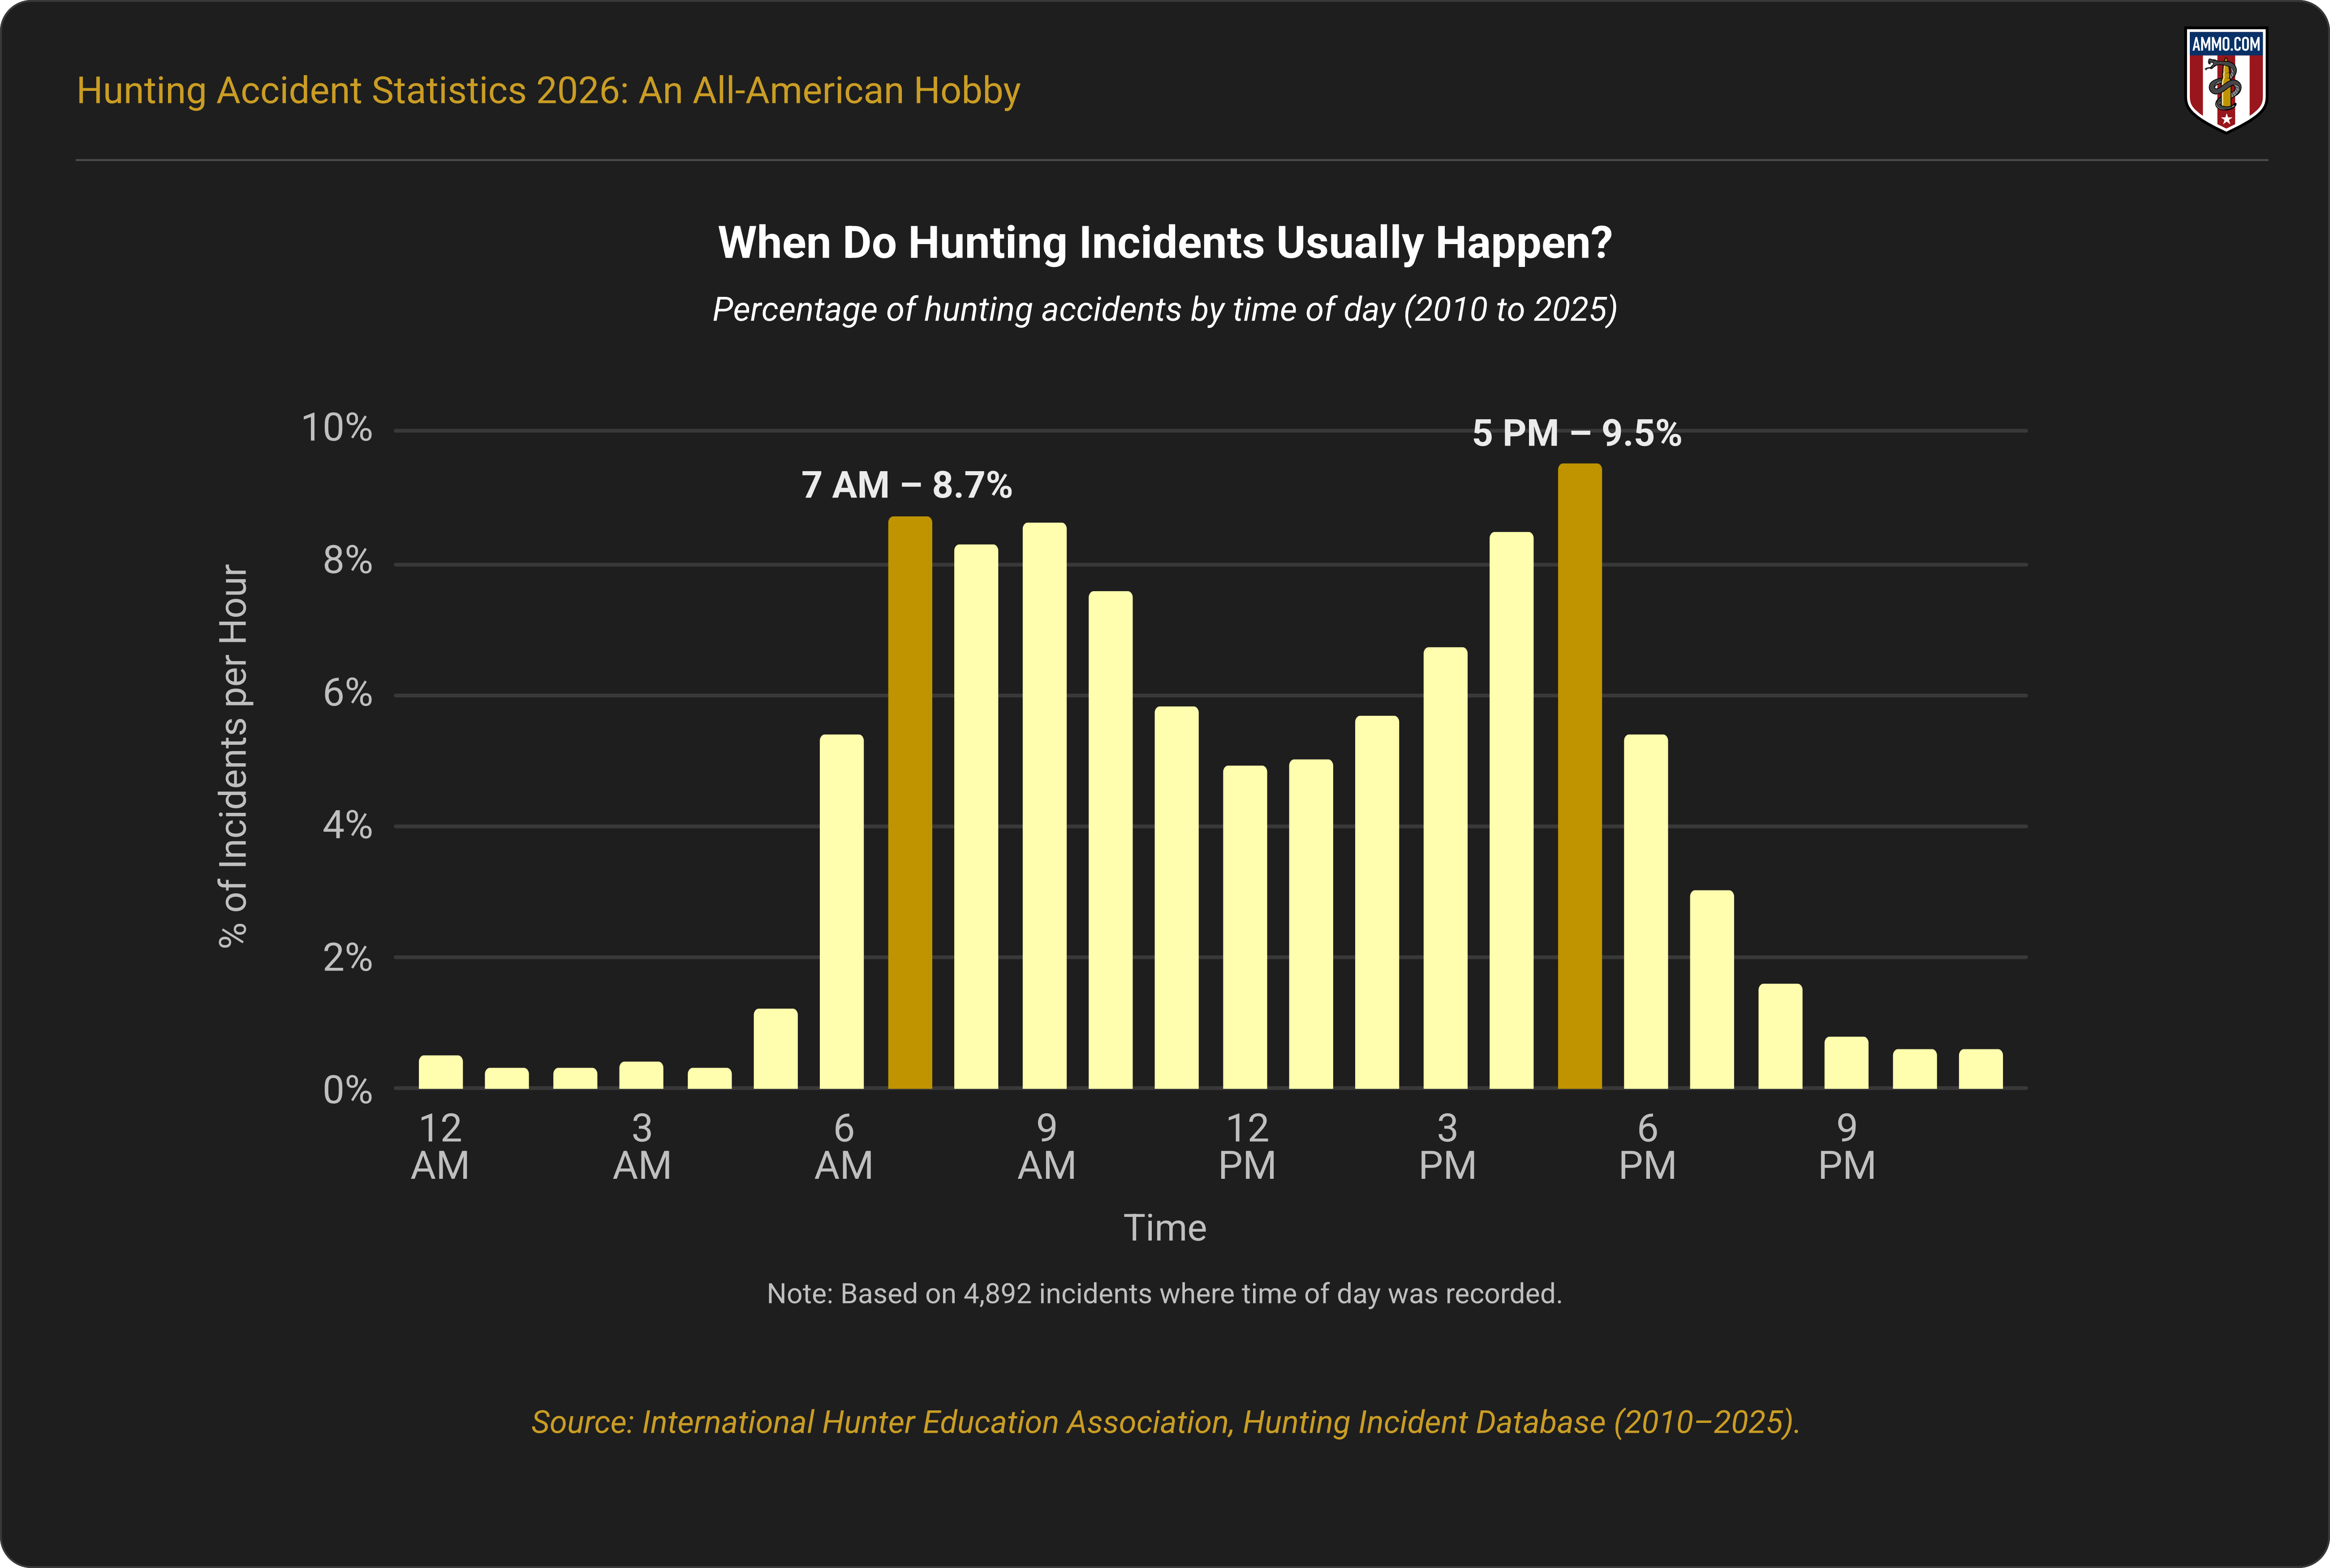
Some estimates suggest that half of all hunting accidents occur within the first or last hours of daylight. Uncoincidentally, these are the best times of day for whitetail hunting.
The IHEA database reported incidents between 2010 and 2025. There were 3,097 incidents where lighting coverage was listed. Of those, 47.5% of incidents occurred in sunlight; 23.9% occurred when it was overcast; 9.8% occurred at dawn; 9.8% occurred at dusk; and 9.0% occurred in the dark.
How Do Hunting Injury Rates Compare?
According to a 2017 National Shooting Sports Foundation (NSSF) report, there were 5,127 tackle football-related injuries for every 100,000 players; 2,196 skateboarding-related injuries for every 100,000 skaters; and only 38 hunting-related injuries for every 100,000 hunters.
From this, we can infer that football players are 135 times more likely to experience an injury than hunters, and skateboarders are 58 times more likely to do the same.
Although the data show that hunting may be safer per participant, they also fail to account for factors such as injury severity, frequency (how often hunters participate in their sport compared to football players or skateboarders), activity duration, and level of physical contact involved.
Injury Incidents by Hobby Compared to Hunting
HOBBY RATE OF INJURY (PER 100K)
Football 5,127
Skateboarding 2,196
Basketball 1,988
Soccer 1,615
Bicycle Riding 1,356
Wrestling 1,326
Cheerleading 1,104
Baseball 1,019
Running/Jogging 668
Weight Lifting 309
Golf 201
Exercising w/ Equipment 114
Bowling 50
Hunting w/ Firearm 38
Billiards 15
Wrap-Up
Hunting accidents do happen, though they’re often attributable to human error. Responsible firearm-handling practices, tree stand maintenance and safety, and proper training and precautions can save hunters’ lives.
If you’re bringing kids along this season, start with our guide to youth gun safety.
Written by Cassandra McBride, https://ammo.com/research/hunting-accident-statistics
SRC image from AI
